Monday, January 30, 2006

Brand Value vs. Brand Valuation

There’s a difference between “brand value” and “brand valuation.” Brand value is the strategic and financial value of the brand to your company today. Brand valuation is a financial exercise intended to put a price on the brand over and above the discounted future cash flows. The difference can be subtle. Tim Ambler of the London Business School uses this metaphor to describe the two: “Since I live in my house and plan to do so for some time, its value to me is the shelter and comfort I derive from it. When I’m prepared to consider selling it, I’ll be interested in the valuation.” Brands work much the same way.

So when should you be looking at brand value and when should you consider brand valuation?Let’s compare the two by first looking at brand value.

Brands create value for companies in several ways:
  • They create customer loyalty, resulting in a lower cost of customer reacquisition and greater likelihood of future sales from existing customers.
  • They lower the perception of risk the company presents to the financial marketplace, resulting in lower borrowing or financing costs.
  • They establish negotiating leverage with suppliers and vendors who seek to be associated with them.
  • They establish the perception of continuity of cash flows into the future amongst investors, thereby increasing the multiple over the company book value that investors are willing to pay for stock.

If these dimensions of brand value are relevant ways for you to gauge the potential return you will create by investing in brand development activities, then you’d benefit by reporting them on a brand scorecard. You may choose to reflect it in competitive comparisons of expected customer lifetime value, perceptions of company “quality” amongst investors and analysts (either through syndicated methods like CoreBrand® or through proprietary research among targeted analysts), an index of company borrowing costs that isolates brand contributions from other marketplace and company variables, or a survey of brand influence within the vendor community.

The most common measure of brand value is one of the difference between market capitalization and either “book value” — the value of the company’s total balance sheet assets — or the net present value of expected future cash flows. Unfortunately, it’s not often reasonable to assume that the difference is mostly attributable to brand value. Channel dominance, patents and technical advantages, sales force effectiveness, and other non-brand elements can be responsible for a big portion of the “intangible” value of the company.

Nevertheless, if your category is one in which investments in brand development are less directly justifiable in terms of customer financial behavior in the near term, you may need to incorporate some element of brand value in your analysis. The best advice we can offer is to sit down with your CFO and discuss the ways you might agree on measuring the brand asset. Typically those fall into two classes. The first is made up of top-down models that seek to explain valuation in terms of the lift in share price that the brand gives you over and above what the company would trade at without a brand. The second approach comes at it from the bottom up. Often called the “economic use” approach, this is an attempt to measure how much incremental cash flow the brand provides over and above what you would get with a “generic” product. The two are philosophically very well aligned. One comes from the macro and hopes to explain the micro, and the other hopes to aggregate the micro to explain superior valuation for the company.

“Brand valuation,” on the other hand, may be relevant to you if your portfolio of brands includes some acquired from other companies, or if you anticipate selling one or more brands at some point in the not-too-distant future.

Accounting regulations in the United States and many other countries require companies to keep close tabs on the “goodwill” assets they carry on their balance sheets from past acquisitions. If the CFO has reason to believe that any acquired brand is no longer worth its carrying value on the balance sheet, she must take a write-down against earnings on the P&L to revise the estimate of value in a process called “asset impairment.”

As a result, companies with acquired brands often need to continually monitor the value of those brands on their brand scorecard to prevent any sudden surprises in earnings.

Similarly, if your company anticipates selling itself in the whole or just selling one or more brands in its portfolio, you may want to begin tracking brand valuation over the period leading up to the sale to understand which potential investments help increase the valuation and which might actually detract from it.

Bottom line: if your primary interest is in measuring the strategic development of brand equity, don't waste time with brand valuation.

Monday, January 23, 2006

Organizational Metrics - Often Overlooked

With most dashboards focused on programatic performance and creation of economic value, it's not hard to understand why critical organizational metrics are often forgotten and left off.

Most large companies spend significant amounts of money on recruiting, training, and developing people in pursuit of productivity and growth. They engage training companies or universities to develop curriculum to improve the specifically desired skills either broadly across the marketing organization or in narrow functional pockets. It's only logical that if the desired outcomes are intended to create economic value, we should consider them to be just like any other element of the marketing mix and measure them on our dashboard.

Using the dashboard to monitor the percentage of your target employees that have achieved the requisite level of training, education, certification, or skill proficiency is mission critical and very appropriate. Succession eligibility is another useful metric for the overall health of the organization. There are two ways to view succession eligibility: first, as the percentage of your senior staff who have groomed replacements ready to step in for them; or second, as the overall percentage of marketing staff who are ready to step up to the next job if they had to. Either of these can be presented in stages of readiness ranging from not-at-all to ready-to-go, which will give you a more dimensional feeling for the progress your organization
is making.


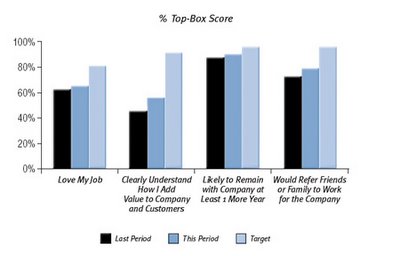
If success in your organization is directly related to employee proficiency and satisfaction, then monitoring employee feedback on your dashboard can be a terrific leading indicator. Many organizations have formal voice of the employee (VOE) programs that survey the employee population frequently on their knowledge, understanding, and enthusiasm for the company’s mission and strategy. Others choose to measure overall job satisfaction in the form of likelihood of referring a friend or family member to buy from or work for the company in the next 90 days. These make strong dashboard metrics to the degree they can be correlated to marketplace success.

Like other metric categories, the key is trying to isolate the most relevant and predictive measures and then working to validate them over time. Just by tracking and featuring many of the prominent organizational evolution goals, you'll be sending the message that you are as committed to achieving them as you are to other marketplace outcomes.

Monday, January 16, 2006

Can You Legitimately Manufacture Data You Need?

Aside from a few purely direct-response businesses like catalog retailing, there is no business today capable of completely and comprehensively measuring marketing effectiveness without some doubt. Even the soundest efforts require that significant assumptions be made to fill the gaps in the data or deal with the uncertainties of dynamic markets, such as:
  • How will competitors react if we do X?
  • Will distributors increase or decrease support?
  • What are commodity prices likely to do?

Decisions based on observable, validated data are usually the best ones. When you have the data, use it. If you’re lucky enough to have the right data in the right quantities for the question at hand, then let your analytical scientists drive and put your instincts in the passenger seat long enough to watch and learn.

But when you don’t have the data and you can’t buy it or develop a clear proxy for it from some other source, you still need to know how to make the decision. Sometimes, you might need to actually make the data. That probably sounds heretical to many of you who’ve invested a great deal of money and energy in beefing up your analytical capabilities. But where the analytics leave off and the questions linger, we succeed or fail by the quality of our guesses.

The one approach for developing data proxies we've used with good success is response modeling, a tool that can help you make better guesses by talking to people with the right experience.

Response modeling in its simplest terms, requires assembling a group of people in your organization whom you believe have the experience to make sound educated guesses on specific issues you want to track. The process involves walking the group through a series of structured question-and-answer sessions — essentially completing a response card — in which you ask each of them very specific questions that zero in on one or more areas of uncertainty.

You might ask a group to predict where a certain product is going to be 12 months from now, then ask them to break that prediction down on a month-by-month basis. Then you ask a series of questions designed to uncover the drivers of the outcome and the relationships between the variables. For example:

  • What would happen to sales if we doubled our advertising?

  • What would happen if we cut it in half?

  • What if we see one or two competitors flood our space with similar products?

  • Based on that situation, what would we see if we doubled our advertising spend? Cut it in half?
During the series of meetings, the group thrashes out the most likely scenarios and debates the answers to these structured questions and the assumptions underlying them. Consensus is NOT necessary. Just peer-reviewed perspectives. The responses then get entered into a computer model and are translated into a curve that expresses the range of variability of the uncertain element and its sensitivity to other variables.

Example: If every manager were asked about the likely effect on profits if advertising were increased by 25%, it would produce a spectrum of possible outcomes from “no effect” (or maybe even “modest decrease”) to “modest increase” to “significant increase.” Those outcomes could be plotted on a curve to show the range of expected outcomes.

Now if we asked for expectations for a 25% decrease, we could also plot those. And if we continued both up and down to 50%, 75%, and 100% increases, as well as 50%, 75%, and 100% decreases, we’d have a pretty clear set of predictions that we could statistically translate into a response model.

If we wanted to get more complex, we could ask the same group to predict the outcome of simultaneously changing advertising spend and changing direct mail. Human beings with experience in the business will use their knowledge and intuition to develop individual best-guess outcomes. The matrix might look like this:


In other words, the collective perspectives of the brightest minds in the company, especially those that disagree on likely outcomes, create a universe of possible outcomes that can be represented by a mathematical algorithm that says for every change of x%+/- in ad spend, profits will change +/-y%.

The model you create represents the collective tribal wisdom on a particular issue that might otherwise be tough to turn into a metric because you don’t have the data. Response models are really nothing more than a highly structured way of helping a management team direct its experience into an aggregated best guess. This may seem unpredictable, but in reality it helps identify the subtle relationships between actions and outcomes while removing some of the risk of any single individual being wildly wrong.

Every manager can form an opinion on the likely result of a certain action or inaction solely on the basis of their experience. The cumulative experience base within a company is often the most powerful untapped data source. Harnessing those individual perspectives into a collective view often provides tremendous insight helpful in making hard decisions. Of course, this approach is vulnerable to bad guessing by the entire group (which would be the Achilles heel of the company anyway), or even to sabotage by those who have an axe to grind against a certain form of spending. But if your group is diverse enough, it’s not hard to minimize these risks and improve the quality of the outcome.

Monday, January 09, 2006

Does Too Much Measurement Constrain Creativity?

Does a comprehensive marketing measurement framework impinge upon the very creativity and innovation marketing needs to provide to the organization? I suppose the answer is, "it depends".

Thomas W. Malone, professor of management at MIT’s Sloan School of Management, has spent the better part of a long academic career researching organizational effectiveness. In his book, The Future of Work: How the New Order of Business Will Shape Your Organization, Your Management Style, and Your Life, Malone points to a “paradox of standards.” He says clearly and firmly defining a few rules (controls) in the most risky areas of the organization sets creativity free in all others.

For example, eBay doesn’t “control” much of what happens on its vast global network. It allows buyers and sellers to interact as they will. What makes the network so successful is the clear framework of rules (the exclusion of certain product categories and bidding processes, for example) that are just firm enough to protect the interests of the greater good and no more restrictive. Certainly no one would accuse eBay of stifling creativity that inhibits growth.

Marketers have long understood this paradox in key efforts like ad copy briefs. Decades of experience have shown that the best creative briefs focus succinctly on a distinct business objective and impose as few firm parameters as possible, but do include some. The creatives must work within the parameters to find new dimensions of communications effectiveness that achieve the business goal. Apply too many parameters, and you’ll get boring, uninspired copy unlikely to accomplish its mission of persuasion. Define too few, and the ads diverge from the strategy, unlikely to create the desired attitudinal or behavioral shifts.

This is how Malone’s “paradox” works. The better defined the playing field is, the more likely the result will be a win. Finding the right balance between objective definition and subjective interpretation is the difference between winning and losing.

But achieving this balance is certainly not easy in the explosive complexity of today’s marketing organization. Several companies who have made good progress report that their success came from evolving from a command-and-control structure to one focused on defining the right set of controls and then applying all energies to drawing the best out of more autonomous, decentralized operating groups.

McDonald’s, for example, has employed a “flexible framework” to deal with the hundreds of customer segments it serves worldwide, across dozens of cultures. To rebuild its brand relevancy after several years of sales attrition, McDonald’s required that communications be open, honest, and fully transparent while speaking in the consumer’s own voice. Beyond that, McDonald’s sets firm expectations for business outcomes and lets the creative process interpret the brand in each culture in ways most appealing to the local customer.

The learning here seems to be that if you choose the right metrics, your measurement framework might actually enhance creativity and innovation by helping to focus them. But the converse is also likely to be true... if your approach to measurement simply reinforces the parameters that constrain the business today, you might very well be accelerating the cycle of monotony.

It might be worthwhile to think about that when you're considering the hundreds of possible dashboard metrics people might want to stuff on the dashboard.

Monday, January 02, 2006

Winning the Guessing Game

Despite all the hand-wringing over marketing getting "a seat at the boardroom table," the irreversible trend we’re seeing in measurement of marketing effectiveness has improved both the return on marketing expenditures and the credibility of the marketing function within the corporation. Database technology, analytics, and Web presentation tools have all contributed to an unstoppable wave of desire to understand and quantify the impact of marketing expenditures on the company’s bottom line. All this is unquestionably for the better.

But there's a much bigger game being played out in corporate boardrooms, one in which dashboards are performing a critically important function. And sometimes marketers get so wrapped up in the financial and statistical orgy of metrics they lose sight of the true competitive advantage afforded by an effective marketing dashboard.

You see, the things that are countable can be counted by anyone. Given similar resources, competitors will always achieve parity with respect to the foundational elements of statistical analysis and optimization. Everyone will soon have their own media-mix model, and portfolio management of ROI will become the de facto standard for how marketing resources are allocated.

But what can truly separate us from our competitors and deliver exploitable marketplace advantage is not being better counters, but becoming better guessers.

Guessing is what we do when we don’t have enough information to be certain about the likely outcome of a decision — which is most of the time.

There’s a strange correlation between the potential magnitude of the risk of a given decision and the propensity to have to guess. The two are directly proportional. That’s why people still manage companies and computers just provide “decision support.”

I've seen effective marketing dashboards facilitate a better guessing organization in two ways:

  1. By assembling the relevant information in a form and manner that improves the ability of the human mind to find the synaptic links between previously unrelated elements and see patterns where no numerical analysis has.

  2. By providing a “learning loop” to rapidly test assumptions (a.k.a. “guesses”) against observable facts to enhance the quality of the decisions in the face of uncertainty.

In a world of rapid assimilation of information, it’s the development of proprietary insights that will distinguish one company from another. Insights can start out as just “guesses” but, through tools like the marketing dashboard, rapidly evolve to become known facts long before the competitors ever figure it out.