While many may be concerned with the validity and reliability of these methods, the alternative of doing nothing should be of greater concern. If our approach to filling data gaps involves key stakeholders from finance, sales, and operations, the resulting models are much more likely to be both accurate and accepted as the “best we can do.”
Remember that credibility is a function of accountability and perceived objectivity. Letting your executive committee know you’re taking all possible steps to answer the key measurement questions will go much further towards establishing that credibility than a dozen analysts working in secret to crack the elusive code of marketing effectiveness.
Before you try to understand why you don’t have data, it makes sense to try to understand the reasons why the data you think you need to measure marketing isn’t available. Asking this question may force some essential critical thinking about what you’re really trying to accomplish and the staffing and resource issues at the root of the problem.
The fishbone exercise is an analysis tool that provides a systematic way of looking at problems and the contributing factors. It’s also called a “cause-and-effect diagram.”
 Here’s how it works:
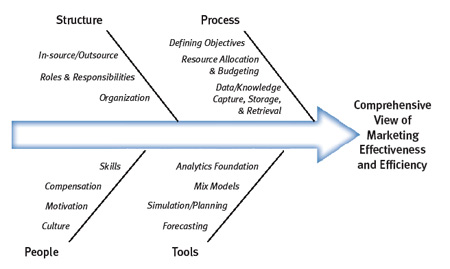
- Decide on the main problem or issue you want to study — and put it at the head of the fish. You might define that problem as “Inability to Measure Marketing Effectiveness” and use the rest of the skeleton to highlight obstacles to be overcome. You can also take a more positive spin by using a label like “Achieving Full Accountability for Marketing Investments” at the head and using the rest of the diagram to identify all the required steps and sub-components of success.
- As you can see, each bone of the fish has a category label. Major categories might include people, process, tools, resources, systems, or suppliers. Use whatever headings relate to what you’ve written at the head of the fish.
- Start brainstorming with your team to identify the factors within each major category that may be affecting the problem. The question to ask is: "What are the issues affecting this category?” Be particularly careful to not let the dominant personalities in the group steer the exercise in parochial directions.
- Work backward up each fishbone to write down sub-factors. Keep asking, "Why is this happening?” until you no longer get useful information.
- Analyze the results of the fishbone after team members agree that the chart is complete. Do this by looking for those items that appear in more than one major category. These repeaters become your most likely causes. These discoveries should create the foundation for an action plan for how to proceed without data.


No comments:
Post a Comment