Monday, March 27, 2006

Integrated Marketing - Careful What You Wish For

When they see the word “integrated,” most marketers think “communications.” They envision public relations, advertising, direct marketing, and promotions all working together harmoniously to deliver a concerted message across channels. That’s the ’90s definition.

In this limited-but-still-common structure, marketing has a box on the org chart reporting to the CEO. Implicit in the functions of that box are the usual marketing responsibilities like advertising, promotions, sponsorships, trade shows, direct, and database management — all the traditional elements of managing the brand.

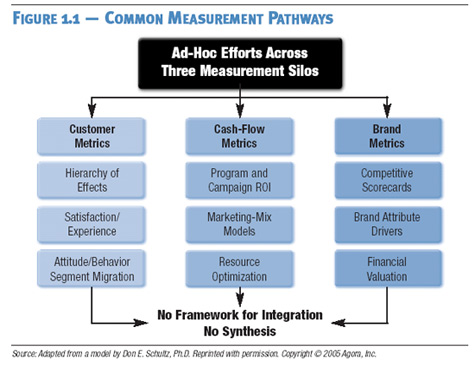
Communications programs are managed for ROI against benchmarks. Media-mix models may be employed to maximize efficiency of advertising dollars, and brand equities may be tracked to gauge progress at favorably influencing perceptions.

Chances are that few, if any, of these measures get much play outside the marketing department. Yet each year marketing budgets reflect the desire of the rest of the company to minimize marketing waste.

The new meaning of “fully integrated” for the marketing department is one that places the emphasis on active collaboration with most, if not all, other departments in the company to improve the appeal, volume, and profitability of the company’s products or services to achieve the maximum value from each customer relationship. A quick glance at the chart below will tell you how your marketing department stands with respect to other roles in the fully integrated organization.


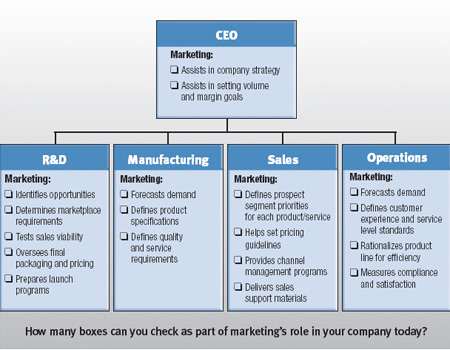
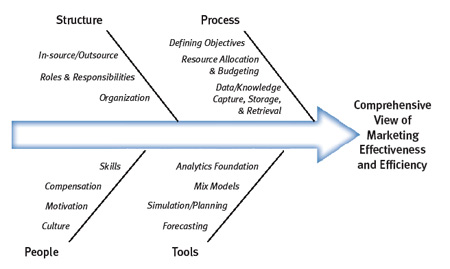
The fully integrated marketing department of today manages the brand on a much more expansive level, taking a clear role in defining and handling many aspects of the customer value proposition from product or service conception to forecasting to sales effectiveness to touchpoint experience. The fully integrated marketing department is much more likely to be linked closely with the overall organizational planning process, in many instances helping to set the strategic agenda for the entire company and establishing key cross-functional milestones like customer satisfaction, share-of-customer penetration, and perceptions of quality. It is more likely to be speaking the same language as the rest of the organization — revenues, operating margins, efficiencies, and process improvement. And the budgeting process for the fully integrated marketing department uses the company’s overall sales and strategic goals as an input variable, not an afterthought.

For those of you thinking, “Yeah, I’d like to get my marketing organization more integrated with the rest of the company and stop being the kid with the nose pressed up against the candy-store window,” be warned: Many marketing careers have been ruined when ambition and a sense of entitlement outstripped organizational ability.

Successfully integrating marketing into other parts of the organization often is not something for which other functional department heads are clamoring. It might not even be on the CEO’s list of good things to do this year. You may need to commit yourself to a slow, steady, and stealthy path of gaining the permission to contribute and building a reputation for adding value without usurping control … which is exactly where your marketing dashboard comes in.

By promoting a cross-functional approach to developing your dashboard, you demonstrate the desires to be both objective and accountable in measuring marketing performance, as well as the leadership skills to reach out to groups with whom you might historically have been in conflict. Requesting (and respecting) their perspectives in how to define and measure marketing success can illuminate the areas where your peers take a different view of the role of marketing and facilitate the dialogue necessary to bridge the gaps, or at least begin the healing.

In short, the process of developing and implementing your dashboard can be the perfect “cover” for redefining the role of marketing in the broader organizational context and further integrating marketing into the core of the business operation.

Monday, March 20, 2006

The Right Metrics Emerge From the Role of Marketing

By now we've all heard about the Spencer Stuart survey that found that the average CMO’s tenure is about 22 months — hardly long enough to see any major initiative through. The key toward longevity, however, may be setting a role for the marketing department that fits the goals of the CEO.

A recent study by the Association of National Advertisers and Booz Allen Hamilton suggests that CMO success is first and foremost a function of knowing what role you’re signing up for. They suggested that there are three different roles of marketing organizations within companies.

Role #1: A Marketing Services Organization
The marketing department is a service provider to the rest of the organization. It provides the benefits of centralization in:
  • media buying;
  • advertising and marcomm materials development and production; and
  • coordination of vendors and agencies.

Role #2: The Marketing Department as Advisor
As a corporate marketing function, the marketing department helps align marketing plans of multiple business units with overall corporate strategies in terms of:

  • brand development, uniformity, and compliance;
  • best-practice sharing across business units; and
  • training/education to improve the breadth and depth of marketing skills throughout the company.

Role #3: Marketing as Growth Driver
The marketing department is the engine of growth for the CEO in driving the corporate agenda; it is responsible for alignment of all necessary resources including:

  • brand strategy and execution;
  • customer touchpoint and customer experience management;
  • product development and innovation;
  • customer value development; and
  • marketing accountability and ROI.

There may be other models or hybrids of the ones above. Regardless, knowing what role marketing is playing in pursuit of the company objectives and confirming it with the CEO and the rest of the executive committee sets the boundaries of the playing field on which marketing is expected to perform. In the process, it suggests some clear opportunities for important dashboard metrics.

Once you have better clarity on how marketing fits into the company strategy map and once you’ve confirmed the role of marketing in the organization, you need to identify the critical performance objectives for the marketing organization. It’s impossible to build a relevant dashboard without knowing what those objectives are.

A good performance objective has three components: direction, magnitude, and timeframe.

Here’s an example: “I will achieve a 20% increase in market share in the next 12 months.” Increasing market share is the direction. Twenty percent is the magnitude. Twelve months is the timeframe. If you take any one of those three components away, you're left with an ineffective statement of objectives open to subjective interpretation. If you take away the magnitude and just say, “I’m going to increase market share,” you have no way to judge how much money you should invest in trying to achieve your goal or how much risk (i.e., spending) you should undertake to do so. If you take away the timeframe and just say you're going to achieve a 20% market share increase, you might be thinking that five years is a reasonable timeframe, while the CEO is thinking one year.

The three parts of a critical performance objective force you to close all the doors of subjectivity. And much like building a dashboard on forecast vs. “rear window,” the process forces you to really think about what exactly it is that you plan to accomplish and how well your strategies and tactics are aligned to do so.

It’s also fairly apparent how the three specific dimensions of critical objectives establish some potentially important candidates for dashboard metrics.

Monday, March 13, 2006

Siloed Measures = Fractured Knowledge

Many of today’s marketing organizations have made significant strides in the development of sophisticated analytical approaches to improve marketing measurement. Ph.D. statisticians are now common in most large marketing departments, as are research departments, media-mix models, and models for assessing the return from a proposed initiative.

But what are they really measuring?

The image below shows the three most common measurement “pathways” marketers are pursuing today.


The customer metrics pathway looks at how prospects become customers. From awareness to preference to trial to repeat purchase, many companies track progression through a “hierarchy of effects” model to track evolution of broad market potential to specific revenue opportunities. This customer pathway also tends to include robust attitudinal data on customer segments — why they want what they want or buy what they buy — which is often correlated with actual customer transactional data to create a robust segmentation model. The segments are then monitored for “mobility” — the directional progression of prospects/customers from one segment to a presumably more valuable one. In many B2B organizations, this customer pathway can go all the way to developing a customer-specific P&L.

The cash-flow metrics pathway focuses on efficiency of marketing expenditures in achieving short-term returns. Program and campaign ROI models measure the immediate impact or net present value of profits expected to be derived from a given investment initiative. Media-mix models use statistical regression techniques to identify which combinations of media placements, integrated media elements, and even copy executions generate the most profitable response from customers. And all of those inputs feed a focus on optimizing resource allocation in the context of generating near-term results.

The brand metrics pathway seeks to track the development of the longer-term impact of marketing through brand health. Survey-based tracking studies gauge customer and prospective customer perspectives on the brand — its functionality, personality, accessibility, and value propositions. Brand scorecards track the evolution of these perspectives over time within market segments and across multiple constituencies like employees, regulators, and community influencers. And many have taken the successful leap to develop financial models for estimating the financial value of the brand as a means of determining the aggregation of assets on the balance sheet as an outcome of marketing investments.

While most larger marketing departments have managed to build effective measurement systems within one or more of the three pathways, few have been able to synthesize across pathways in a manner that helps one pathway explain another or clarifies the predictive drivers of the business on a broader level.

For most companies, it’s actually not possible to do this scientifically because it’s not an econometric modeling problem solvable by equations and computers. Each pathway measures very different components of marketing effectiveness in very different ways. Some are shorter term and some longer term. Linking them algorithmically forces you to make some very large assumptions that may be unreliable in the face of actual marketplace dynamics. And even if you can solve it algorithmically, you will likely have to employ statistical techniques of such sophistication that no one in either marketing or finance will understand sufficiently to embrace and defend the method.

A marketing dashboard helps present the insights from all three of the pathways in a graphically related view that facilitates the human brain’s incredible power to find subtle contextual links. This is the point where the “art” and “science” of marketing need to blend.

Most CMOs still struggle to close the gap and embrace the scientific measurement practices and the remaining “art” components that seemingly defy measurement in any reasonable fashion yet are highly correlated with success. As with most other aspects of business, the science enables greatness, but the application of imagination and innovation is what delivers it.

It is this very “art” component of marketing that requires the CMO to have the full confidence and trust of his or her CEO and the executive committee. To win this credibility, today’s CMO needs to find ways of measuring risk that are transparent and understandable to all. If you want top management to accept the art you bring to the process, you have to do a better job of quantifying the chances for success. Only in the rarest organizations will marketing chiefs get by with the words “trust me.” These days, leaps of faith come with pretty heavy price tags.

Monday, March 06, 2006

Getting Past "Don't Have the Data"

Not having the right data is no longer a valid excuse for leaving key business drivers off your dashboard. Find a disciplined way to get at best estimates of the data you seek. Create a continuous improvement path to begin collecting and validating it. And look to the intersection of quantitative research and basic statistical tools to help refine and enhance both your diagnostic and predictive capabilities.

While many may be concerned with the validity and reliability of these methods, the alternative of doing nothing should be of greater concern. If our approach to filling data gaps involves key stakeholders from finance, sales, and operations, the resulting models are much more likely to be both accurate and accepted as the “best we can do.”

Remember that credibility is a function of accountability and perceived objectivity. Letting your executive committee know you’re taking all possible steps to answer the key measurement questions will go much further towards establishing that credibility than a dozen analysts working in secret to crack the elusive code of marketing effectiveness.

Before you try to understand why you don’t have data, it makes sense to try to understand the reasons why the data you think you need to measure marketing isn’t available. Asking this question may force some essential critical thinking about what you’re really trying to accomplish and the staffing and resource issues at the root of the problem.

The fishbone exercise is an analysis tool that provides a systematic way of looking at problems and the contributing factors. It’s also called a “cause-and-effect diagram.”

Here’s how it works:
  1. Decide on the main problem or issue you want to study — and put it at the head of the fish. You might define that problem as “Inability to Measure Marketing Effectiveness” and use the rest of the skeleton to highlight obstacles to be overcome. You can also take a more positive spin by using a label like “Achieving Full Accountability for Marketing Investments” at the head and using the rest of the diagram to identify all the required steps and sub-components of success.

  2. As you can see, each bone of the fish has a category label. Major categories might include people, process, tools, resources, systems, or suppliers. Use whatever headings relate to what you’ve written at the head of the fish.

  3. Start brainstorming with your team to identify the factors within each major category that may be affecting the problem. The question to ask is: "What are the issues affecting this category?” Be particularly careful to not let the dominant personalities in the group steer the exercise in parochial directions.

  4. Work backward up each fishbone to write down sub-factors. Keep asking, "Why is this happening?” until you no longer get useful information.

  5. Analyze the results of the fishbone after team members agree that the chart is complete. Do this by looking for those items that appear in more than one major category. These repeaters become your most likely causes. These discoveries should create the foundation for an action plan for how to proceed without data.
Another good thing about the fishbone exercise is that it’s a great way to bring in constituents from outside the marketing department — finance, sales, or SBU leaders — to get them to talk about their own departmental measurement challenges. You listen to their problems, they listen to yours, and soon you have allies in your process to overcome obstacles to measurement. Most importantly, they may have already come up with some novel metrics you can adapt for your specific purposes.