Tuesday, May 23, 2006

Setting Priorities to Succeed

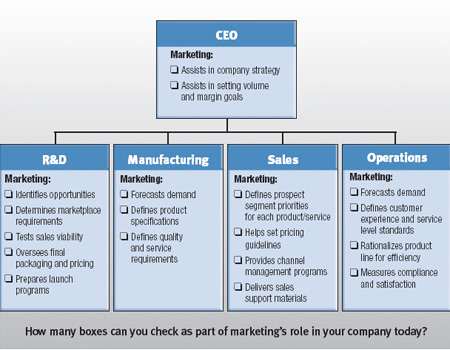
The surest way to realize the role of marketing you seek is to begin with the right vision. That means dissecting the customer value chain and finding all the places where marketing can and should play a role in improving it. But before you launch headlong into such an initiative, here are some thoughts on common pitfalls that await...

4 Ways to Lose Your Way

  1. Losing track of your base. Before you seek to expand into new areas of influence, make sure you have strong process and people managing the current scope of marketing responsibilities. You’ll also need strong measurement abilities to get early warnings of problems within the marketing department. Identify the biggest risks to your present activities, and develop mitigation strategies for each. You can’t open new frontiers while fighting wars on the homefront.

  2. Sticking your nose where it isn’t welcome. Before you leap to conclusions about how something outside your traditional scope can be better, ask the people managing that part of the company. Find out what worries and frustrates them. Ask them how they measure success, and see if there are more customer-centric ways of doing so that engage them. Use your credibility and capacity in customer research to help them achieve their goals. If they perceive that your interest is motivated by self-aggrandizement, you can forget about cooperation. The door will close hard, and your swollen nose will be on display for the rest of the company to see. Ground your interest in achieving measurably better results for everyone. It’s a difficult entreaty to resist.

  3. Stretching your skill supply lines too far. Apart from the two gaffes listed already, the biggest mistake in seeking to expand influence is to get enthusiastic support from other functional heads and deliver well-meaning under-execution a few months later. The skill set of your staff must align with the value-added tasks for which you volunteer or your weaknesses will show themselves quickly. If you’ve taken the time to diagram where in the company you would like to get involved, take a few extra weeks to think through the skills necessary to succeed and your ability to get them into your arsenal either through hiring of staff or consultants or development of existing employees. Many times the reason the value-added activity isn’t being done (or done well) is because the current manager doesn’t have the requisite skill set on his or her team. Jumping in before sizing the challenge properly can make for a particularly unpleasant experience for everyone involved.

  4. Dying by scope-creep. There’s only one real downside to success: popularity. Once you’re successful at creating value across many areas of the organization, the risk changes to one of having such a great reputation for results that everyone wants your help. Before you know it, your marketing team is being pulled in so many directions that it’s spending too much time on trivial requests from newfound friends around the company and not enough on high-leverage initiatives that really drive results. Protect your focus diligently, and work with sales, operations, R&D, etc., to develop some clear rules of engagement marketing.

Setting Priorities to Succeed

Once you’ve mapped out a path that avoid the pitfalls, prioritize your opportunities on the basis of the likely impact on business results and the anticipated receptivity from the current functional owners. Your two-by-two matrix of opportunities will highlight those areas in which your approach will be received warmly. From this list build your marketing scope one step at a time, ensuring that you have the permission and capacity to succeed.

Tuesday, May 16, 2006

3 Ways to Structure Marketing Measurement Resources

A common question CMOs ask each other when discussing marketing measurement is "Where did you put your measurement group?" The question underscores conflicting desires to have measurement people close, but not too close. Our research suggests that there are three primary models in broad use today relative to the organizational structure of marketing measurement resources.

Model 1 — The Internal Resource

Many marketing organizations today have at least one dedicated measurement analyst on staff. These people are sometimes academically trained statisticians and other times financial analysts. In a few rare cases both disciplines are represented for a balanced perspective.

These internal resources most often report indirectly to the CMO through a vice president of advertising, vice president of database marketing, or vice president of strategic planning. In a few instances, CMOs have created dedicated VP-level jobs for marketing performance planning and given that person responsibility for coordinating back-end effectiveness measurement with strategic planning, developing HR performance, and managing business-case requests for resources.


Model 2 — The Shared Resource

Another, less frequently found model is a stand-alone analytical group shared between any two or more functional groups like marketing, finance, sales, and operations. These stand-alone groups most often report into finance but have dedicated resources supporting the partnering functions. Sometimes, they report into a COO or president, primarily to support corporate planning and development, and are staffed to provide centralized support for the other functions as well.


The skills in these shared resource groups tend to be a blend of those with advanced degrees in statistics and those with strong backgrounds in finance or accounting. By their nature, these groups tend to be larger and have better software tools. For capacity and expertise reasons, they work directly with marketing personnel on front-end planning and back-end measurement and with some of the more marketing-specific analytics outsourced to vendors.

Model 3 — Informal Marketing/Finance Collaboration

The most common organizational approach to marketing measurement — informal collaboration — is characterized by no one person or group having responsibility for marketing measurement. Marketing staff work with finance staff whenever they see the need for a business case to be developed or a program ROI to be determined. Finance, on the other hand, asks randomly-timed questions about assumptions, returns, and resource allocation plans.


Some of these informal collaborations work on the strength of the friendships between individuals. Others survive in an environment where corporate expectations for marketing accountability are still low enough that measurement is an afterthought more than a decision process.


Each one of these models has merits and downsides. Informal models and shared resources are lower cost, but also lower on specific expertise. Internal resources are potentially most useful to marketing, but often resource constrained. No matter which model your company may have or be considering, understanding the tradeoffs and evolution path with help you manage the function for optimal benefit.

Tuesday, May 09, 2006

The Business Case for Loyalty

The key to loyalty measurement is having a very clear picture of the economic value you are trying to create. If there is no expectation of superior economic value in either the short or long term, then initiatives intended to inspire customer loyalty can't possibly pass the basic business-case test that returns must exceed investment.


For most businesses, the promise of customer loyalty implies potential economic value creation with some combination of the following five dimensions:

  • First, many companies invest disproportionately in customer acquisition at the beginning of the relationship, placing themselves in a negative economic position. The hope (a.k.a. "the plan") is to pay off the initial investment many times over through retaining customers and capturing the lion's share of their spending in the category year after year.

  • Second, loyal customers may be inclined to buy more types and more volume of products and services from you (cross-selling and up-selling), thereby generating an enhanced return over the life of the relationship.

  • Third, loyalty can be a strategy for reducing ongoing expense. A company that is retaining customers is one that can, in theory, reduce its investment in customer replacement. By closing the proverbial hole in the bottom of the bucket through which customers leak out, the company can improve profitability substantially. If you hear a lot of companies talking about the importance of customer retention, it's because they have good reason. Competition in most industries is brutal. Customers are promiscuous. Couple these trends with the old-but-true saw that it costs more to acquire a customer than it does to retain one, and focusing your marketing efforts on existing customers makes sound business sense. This was amply demonstrated by Frederick Reichheld in his breakthrough 1996 study, The Loyalty Effect. It analyzed the bottom-line value of an additional five percentage points in retention rate, across a variety of industries.

  • Fourth, customer loyalty can be associated with lower price elasticity. By trusting and engaging with your company and its offerings, customers may be willing to pay more for the privilege of doing business with you. And, higher margins almost always drop to the bottom line.

  • And finally, loyalty can be equated with the mother of all profitability engines — referrals. If loyal customers are happy customers, then it's likely they are unpaid ambassadors for your company, spreading the word on how wonderful it is to do business with you. That saves you real money in reduced customer acquisition costs.


To arrive at the financial benefit, you must be clear on which of the dimensions above your investments are designed to affect. Once you've made the investment decision, you should do the modeling and analysis required to measure how well the investments performed. Investing without goals and measurement leaves you vulnerable to questions that you cannot answer, undermining your credibility even if the results are ultimately positive.

Tuesday, May 02, 2006

CMOs: Get a Contract

We've all read that CMO job longevity is presently, on average, something less than two years. The 22 months or so CMOs last on the job hardly gives one tenure enough to see initiatives through. The implication seems to be that either CEOs feel CMOs fail to achieve what they were brought in to do or CMOs depart frustrated that they couldn't do what they thought they were brought in to do.

A recent study by the Association of National Advertisers and Booz Allen Hamilton suggests that CMO success is highly correlated to five key components.

1. Knowing What Role You're Signing Up for

The study identified three basic types of roles for marketing.


Knowing which of the three the CEO has in mind will clearly outline what lies ahead.


2. Getting It in Writing

Although it's best to do this before you even accept the job offer, a marketing contract between CMO and CEO is a good idea any time there isn't perfect alignment between the two on what's getting done and how. Too many times, both assume that they're on the same track when in fact they have very different perspectives.

A good marketing contract details how you plan and execute your charter. Without a contract, it is difficult to impossible for either you or the CEO to measure performance and unlikely that either of you will be satisfied.


3. Developing Organizational Linkages

Unique in the organization, CMOs influence not only their direct reports, but many others throughout the organization, including such traditionally unaligned groups as sales, manufacturing, R&D, even marketers within other divisional profit centers. That exposes the marketing group to lots of entropy from the rest of the organization. Set boundaries on clear responsibilities and decision-making autonomy with functional peers on the executive committee to avoid letting the pressure of "urgent" issues drive out collaboration on the important ones.

4. Driving a Marketing Capability Agenda

Because CEOs (and CFOs) are asking more of marketing these days, marketing definitely needs a team capable of meeting high and escalating expectations of financial returns, measurement, and accountability. Blending data collection, analysis, and planning adaptability takes on paramount importance. Without a rigorous assessment of the team's ability to succeed on these dimensions, you're metaphorically walking into a gunfight with a pocket knife.

5. Taking More, Smarter Risks

Marketing, almost paradoxically, also needs to take some bigger risks. Driving topline growth is job No. 1 for most CEOs these days, and CMOs just can't get there from within the protective cocoon of the current marketing processes. Marketing has to let the glow of innovation and creativity in, and develop feedback and measurement systems that temper the risk and forecast the profit potential of bigger initiatives.

Of course it's not always practical to get all of these understandings written out in the form of a contract. Our advice is just to make sure you get them committed to writing and shared in one form or another. Take notes during discussions and send e-mail summaries after the meeting. Casual. Informal. Then over time aggregate the understandings to build on one another until you have a more comprehensive document that you can share as a "summary of understanding."

Thursday, April 27, 2006

Increase Brand Measurement Frequency for Relevancy

Brand perceptions aren’t static — consumer loyalties can last over a lifetime or end in a few short days. And that often runs counter to a company’s own brand perception, which can remain pointlessly unchanged. Most companies, even many with huge research budgets, don’t carefully monitor the clarity, or lack of clarity, their brand has with customers and prospects at any given point in time. A brand value proposition that made a lot of sense under one set of industry circumstances may degrade to irrelevance and become a commodity position if it stays too long in one place.

Most often, brand attributes are monitored in large-scale tracking studies conducted in waves three, six, or 12 months apart. If your category evolves faster than the frequency of your tracking studies, these periodic reads may provide irrelevant historical information and present a picture that bears little resemblance to today’s reality — especially when you consider that it often takes four to six weeks from the end of survey fielding until the report gets on your desk.

Many organizations are today migrating towards “continuous” brand tracking, with smaller samples fielded each week or month that are then read in the aggregate over a rolling six, eight, or 12 weeks. While a bit more expensive, this approach can repeatedly check the temperature of customers and prospects to ensure you are maintaining a healthy relationship, in addition to potentially measuring the impacts of marketing stimulus programs on brand attributes with greater reliability.

The bottom line is you need to clearly know what your brand is and what it means to the target customer. If you don’t, you are prone to serious over- or underestimations of your brand strength. Without an effective brand scorecard, you might not have an accurate picture of where your brand stands or where it’s headed. With one, you have no excuses not to.

Thursday, April 20, 2006

Market Knowledge: Part 2 - Smarts Alone Don’t Count for Much

In my last entry, I discussed research conducted at Case Western Reserve University and published in the Journal of Marketing that explored how a company’s market knowledge and strategic actions drive its innovation and performance over time. I have one more point to make before we leave this study.

Knowledge is interpreted information — beliefs, understandings, commitments, etc. We create meaning by distinguishing and valuing information.

In the research, decision makers’ knowledge about customer preferences was assessed through a series of questions that they answered immediately after they had made decisions but before they had seen the performance outcomes. They marked the location of various customer segments' ideal points on a perceptual map. The accuracy of their knowledge was judged by the distance between the points they specified on the map and the ideal points for each customer segment, provided by a simulation tool.

The results confirmed that if there is little shared knowledge in a firm, an increase in an individual’s overall market knowledge has no impact on innovation effort. On the flip side, more dynamic shared knowledge environments act as catalysts for higher individual levels of market knowledge, generating significantly greater levels of innovation.

The results also suggest that innovation effort takes shape over time under the influence of opposing forces: market knowledge diffusion, which propels innovation, and a “complacency” with past performance, which hinders it.

For the whole story, check out "Actualizing Innovation Effort: The Impact of Market Knowledge Diffusion in a Dynamic System of Competition" by Detelina Marinova from the July 2004 Journal of Marketing at www.marketingpower.com.


Thursday, April 13, 2006

Market Knowledge: Part 1 - Use It or Lose It

Companies act on the basis of market knowledge: the knowledge of customers and competitors as garnered by individual employees. An organization's ability to recognize the value of new information, assimilate it, and use it strategically accounts for its success in performance and innovation.

Research conducted at Case Western Reserve University and published in the Journal of Marketing explored how a company’s market knowledge and strategic actions drive its innovation and performance over time.

Knowledge for Improvement ... and Apathy

Intelligence about the market is necessary to satisfy customers better than the competition can. However, researchers discovered that when decision makers find a useful nugget of knowledge, they tend to rely on it and avoid updating it to accommodate new developments. In many instances, it's counterintuitive, let alone time-consuming, resource-zapping, etc., to update knowledge that works.

Similarly, decision makers may resist reconsidering their individual market knowledge after communicating with others in the organization. This is particularly troublesome when you consider that new and improved products get to market only by swapping information and surfacing new know-how.

They also found that changes in the quantity of market knowledge are likely to intensify the need to adjust marketing and general business strategy. Marketers may say, "Whoa, we don’t have that data anymore? We'd better make some changes." Or they may draw inward: "We have no new data. We'd better stick with our current product line-up and marketing strategy. Anything new would be a shot in the dark, and we certainly don't want to risk whatever good we have going now." Worse yet, they may delight in a data deluge and push to use the new information somehow to a competitive advantage.

More in Part 2 Above

Monday, April 03, 2006

Is ROI Misleadingly Simple?

In a word, perhaps.
The simple formula for calculating ROI is:

ROI = NPV of Incremental Profits (Incremental Revenue – Expenses)
Initial Expenses

Where “NPV” is the net present value of a series of profits realized over a period of time, discounted back to current dollars.

Many marketers and academics have denounced the use of an ROI formula in measuring marketing effectiveness as “too limiting” or possibly “misleading.” I agree. Used in the wrong way or poorly manipulated, ROI calculations can be as imprecise and subject to misinterpretation as any other statistical or financial assessment tool. (Check out Tim Ambler’s opinion on the subject.). And pursuing alternatives that offer the highest ROI can often expose you to significant risks of short-sighted resource allocation.

However, when used properly in the context of driving more profit — not just getting the highest possible ROI score — ROI measurement is a reasonable way to standardize the process of gauging the relative value of one marketing investment against another.

If every marketing investment is held to the standard of ultimately creating some profitable change in customer or market behavior, then we can successfully compare all proposed investments using a standardized assessment process to identify those offering the greatest potential for driving profits. Sure, we might need to make some assumptions, but if we place some significant effort on trying to anticipate the intended behavior changes upfront in the planning stages, we can often identify ways to better structure our investments to help promote reliable measurement of results. This in turn helps us see where our assumptions were accurate, where they were less so, and why. Over time, our assumptions get better and better in planning our investments and achieving maximum return.

A consistent framework for assessing marketing returns allows marketing executives to:
  • identify places where spending is most effective;
  • correlate the individual and collective impact of marketing initiatives on prospect or customer behaviors, then link those behaviors to the financial value drivers;
  • reallocate people or dollar resources towards greater impact — for example, this can include taking an underperforming initiative and retargeting it toward a high-value segment, eliminating unprofitable channel gaps and addressing identified leaks in the funnel progression; and
  • extend campaign-level profitability to customer-level profitability across multiple acquisition, retention, and cross-sell campaigns that will optimize customer value.

Just be careful not to get trapped into believing that the ROI calculation gives you this insight. It's the process of asking the right questions and applying the best measures that generates insight. ROI is only one possible measure. Others are discussed in other posts in this blog.

Monday, March 27, 2006

Integrated Marketing - Careful What You Wish For

When they see the word “integrated,” most marketers think “communications.” They envision public relations, advertising, direct marketing, and promotions all working together harmoniously to deliver a concerted message across channels. That’s the ’90s definition.

In this limited-but-still-common structure, marketing has a box on the org chart reporting to the CEO. Implicit in the functions of that box are the usual marketing responsibilities like advertising, promotions, sponsorships, trade shows, direct, and database management — all the traditional elements of managing the brand.

Communications programs are managed for ROI against benchmarks. Media-mix models may be employed to maximize efficiency of advertising dollars, and brand equities may be tracked to gauge progress at favorably influencing perceptions.

Chances are that few, if any, of these measures get much play outside the marketing department. Yet each year marketing budgets reflect the desire of the rest of the company to minimize marketing waste.

The new meaning of “fully integrated” for the marketing department is one that places the emphasis on active collaboration with most, if not all, other departments in the company to improve the appeal, volume, and profitability of the company’s products or services to achieve the maximum value from each customer relationship. A quick glance at the chart below will tell you how your marketing department stands with respect to other roles in the fully integrated organization.


The fully integrated marketing department of today manages the brand on a much more expansive level, taking a clear role in defining and handling many aspects of the customer value proposition from product or service conception to forecasting to sales effectiveness to touchpoint experience. The fully integrated marketing department is much more likely to be linked closely with the overall organizational planning process, in many instances helping to set the strategic agenda for the entire company and establishing key cross-functional milestones like customer satisfaction, share-of-customer penetration, and perceptions of quality. It is more likely to be speaking the same language as the rest of the organization — revenues, operating margins, efficiencies, and process improvement. And the budgeting process for the fully integrated marketing department uses the company’s overall sales and strategic goals as an input variable, not an afterthought.

For those of you thinking, “Yeah, I’d like to get my marketing organization more integrated with the rest of the company and stop being the kid with the nose pressed up against the candy-store window,” be warned: Many marketing careers have been ruined when ambition and a sense of entitlement outstripped organizational ability.

Successfully integrating marketing into other parts of the organization often is not something for which other functional department heads are clamoring. It might not even be on the CEO’s list of good things to do this year. You may need to commit yourself to a slow, steady, and stealthy path of gaining the permission to contribute and building a reputation for adding value without usurping control … which is exactly where your marketing dashboard comes in.

By promoting a cross-functional approach to developing your dashboard, you demonstrate the desires to be both objective and accountable in measuring marketing performance, as well as the leadership skills to reach out to groups with whom you might historically have been in conflict. Requesting (and respecting) their perspectives in how to define and measure marketing success can illuminate the areas where your peers take a different view of the role of marketing and facilitate the dialogue necessary to bridge the gaps, or at least begin the healing.

In short, the process of developing and implementing your dashboard can be the perfect “cover” for redefining the role of marketing in the broader organizational context and further integrating marketing into the core of the business operation.

Monday, March 20, 2006

The Right Metrics Emerge From the Role of Marketing

By now we've all heard about the Spencer Stuart survey that found that the average CMO’s tenure is about 22 months — hardly long enough to see any major initiative through. The key toward longevity, however, may be setting a role for the marketing department that fits the goals of the CEO.

A recent study by the Association of National Advertisers and Booz Allen Hamilton suggests that CMO success is first and foremost a function of knowing what role you’re signing up for. They suggested that there are three different roles of marketing organizations within companies.

Role #1: A Marketing Services Organization
The marketing department is a service provider to the rest of the organization. It provides the benefits of centralization in:
  • media buying;
  • advertising and marcomm materials development and production; and
  • coordination of vendors and agencies.

Role #2: The Marketing Department as Advisor
As a corporate marketing function, the marketing department helps align marketing plans of multiple business units with overall corporate strategies in terms of:

  • brand development, uniformity, and compliance;
  • best-practice sharing across business units; and
  • training/education to improve the breadth and depth of marketing skills throughout the company.

Role #3: Marketing as Growth Driver
The marketing department is the engine of growth for the CEO in driving the corporate agenda; it is responsible for alignment of all necessary resources including:

  • brand strategy and execution;
  • customer touchpoint and customer experience management;
  • product development and innovation;
  • customer value development; and
  • marketing accountability and ROI.

There may be other models or hybrids of the ones above. Regardless, knowing what role marketing is playing in pursuit of the company objectives and confirming it with the CEO and the rest of the executive committee sets the boundaries of the playing field on which marketing is expected to perform. In the process, it suggests some clear opportunities for important dashboard metrics.

Once you have better clarity on how marketing fits into the company strategy map and once you’ve confirmed the role of marketing in the organization, you need to identify the critical performance objectives for the marketing organization. It’s impossible to build a relevant dashboard without knowing what those objectives are.

A good performance objective has three components: direction, magnitude, and timeframe.

Here’s an example: “I will achieve a 20% increase in market share in the next 12 months.” Increasing market share is the direction. Twenty percent is the magnitude. Twelve months is the timeframe. If you take any one of those three components away, you're left with an ineffective statement of objectives open to subjective interpretation. If you take away the magnitude and just say, “I’m going to increase market share,” you have no way to judge how much money you should invest in trying to achieve your goal or how much risk (i.e., spending) you should undertake to do so. If you take away the timeframe and just say you're going to achieve a 20% market share increase, you might be thinking that five years is a reasonable timeframe, while the CEO is thinking one year.

The three parts of a critical performance objective force you to close all the doors of subjectivity. And much like building a dashboard on forecast vs. “rear window,” the process forces you to really think about what exactly it is that you plan to accomplish and how well your strategies and tactics are aligned to do so.

It’s also fairly apparent how the three specific dimensions of critical objectives establish some potentially important candidates for dashboard metrics.

Monday, March 13, 2006

Siloed Measures = Fractured Knowledge

Many of today’s marketing organizations have made significant strides in the development of sophisticated analytical approaches to improve marketing measurement. Ph.D. statisticians are now common in most large marketing departments, as are research departments, media-mix models, and models for assessing the return from a proposed initiative.

But what are they really measuring?

The image below shows the three most common measurement “pathways” marketers are pursuing today.


The customer metrics pathway looks at how prospects become customers. From awareness to preference to trial to repeat purchase, many companies track progression through a “hierarchy of effects” model to track evolution of broad market potential to specific revenue opportunities. This customer pathway also tends to include robust attitudinal data on customer segments — why they want what they want or buy what they buy — which is often correlated with actual customer transactional data to create a robust segmentation model. The segments are then monitored for “mobility” — the directional progression of prospects/customers from one segment to a presumably more valuable one. In many B2B organizations, this customer pathway can go all the way to developing a customer-specific P&L.

The cash-flow metrics pathway focuses on efficiency of marketing expenditures in achieving short-term returns. Program and campaign ROI models measure the immediate impact or net present value of profits expected to be derived from a given investment initiative. Media-mix models use statistical regression techniques to identify which combinations of media placements, integrated media elements, and even copy executions generate the most profitable response from customers. And all of those inputs feed a focus on optimizing resource allocation in the context of generating near-term results.

The brand metrics pathway seeks to track the development of the longer-term impact of marketing through brand health. Survey-based tracking studies gauge customer and prospective customer perspectives on the brand — its functionality, personality, accessibility, and value propositions. Brand scorecards track the evolution of these perspectives over time within market segments and across multiple constituencies like employees, regulators, and community influencers. And many have taken the successful leap to develop financial models for estimating the financial value of the brand as a means of determining the aggregation of assets on the balance sheet as an outcome of marketing investments.

While most larger marketing departments have managed to build effective measurement systems within one or more of the three pathways, few have been able to synthesize across pathways in a manner that helps one pathway explain another or clarifies the predictive drivers of the business on a broader level.

For most companies, it’s actually not possible to do this scientifically because it’s not an econometric modeling problem solvable by equations and computers. Each pathway measures very different components of marketing effectiveness in very different ways. Some are shorter term and some longer term. Linking them algorithmically forces you to make some very large assumptions that may be unreliable in the face of actual marketplace dynamics. And even if you can solve it algorithmically, you will likely have to employ statistical techniques of such sophistication that no one in either marketing or finance will understand sufficiently to embrace and defend the method.

A marketing dashboard helps present the insights from all three of the pathways in a graphically related view that facilitates the human brain’s incredible power to find subtle contextual links. This is the point where the “art” and “science” of marketing need to blend.

Most CMOs still struggle to close the gap and embrace the scientific measurement practices and the remaining “art” components that seemingly defy measurement in any reasonable fashion yet are highly correlated with success. As with most other aspects of business, the science enables greatness, but the application of imagination and innovation is what delivers it.

It is this very “art” component of marketing that requires the CMO to have the full confidence and trust of his or her CEO and the executive committee. To win this credibility, today’s CMO needs to find ways of measuring risk that are transparent and understandable to all. If you want top management to accept the art you bring to the process, you have to do a better job of quantifying the chances for success. Only in the rarest organizations will marketing chiefs get by with the words “trust me.” These days, leaps of faith come with pretty heavy price tags.

Monday, March 06, 2006

Getting Past "Don't Have the Data"

Not having the right data is no longer a valid excuse for leaving key business drivers off your dashboard. Find a disciplined way to get at best estimates of the data you seek. Create a continuous improvement path to begin collecting and validating it. And look to the intersection of quantitative research and basic statistical tools to help refine and enhance both your diagnostic and predictive capabilities.

While many may be concerned with the validity and reliability of these methods, the alternative of doing nothing should be of greater concern. If our approach to filling data gaps involves key stakeholders from finance, sales, and operations, the resulting models are much more likely to be both accurate and accepted as the “best we can do.”

Remember that credibility is a function of accountability and perceived objectivity. Letting your executive committee know you’re taking all possible steps to answer the key measurement questions will go much further towards establishing that credibility than a dozen analysts working in secret to crack the elusive code of marketing effectiveness.

Before you try to understand why you don’t have data, it makes sense to try to understand the reasons why the data you think you need to measure marketing isn’t available. Asking this question may force some essential critical thinking about what you’re really trying to accomplish and the staffing and resource issues at the root of the problem.

The fishbone exercise is an analysis tool that provides a systematic way of looking at problems and the contributing factors. It’s also called a “cause-and-effect diagram.”

Here’s how it works:
  1. Decide on the main problem or issue you want to study — and put it at the head of the fish. You might define that problem as “Inability to Measure Marketing Effectiveness” and use the rest of the skeleton to highlight obstacles to be overcome. You can also take a more positive spin by using a label like “Achieving Full Accountability for Marketing Investments” at the head and using the rest of the diagram to identify all the required steps and sub-components of success.

  2. As you can see, each bone of the fish has a category label. Major categories might include people, process, tools, resources, systems, or suppliers. Use whatever headings relate to what you’ve written at the head of the fish.

  3. Start brainstorming with your team to identify the factors within each major category that may be affecting the problem. The question to ask is: "What are the issues affecting this category?” Be particularly careful to not let the dominant personalities in the group steer the exercise in parochial directions.

  4. Work backward up each fishbone to write down sub-factors. Keep asking, "Why is this happening?” until you no longer get useful information.

  5. Analyze the results of the fishbone after team members agree that the chart is complete. Do this by looking for those items that appear in more than one major category. These repeaters become your most likely causes. These discoveries should create the foundation for an action plan for how to proceed without data.
Another good thing about the fishbone exercise is that it’s a great way to bring in constituents from outside the marketing department — finance, sales, or SBU leaders — to get them to talk about their own departmental measurement challenges. You listen to their problems, they listen to yours, and soon you have allies in your process to overcome obstacles to measurement. Most importantly, they may have already come up with some novel metrics you can adapt for your specific purposes.

Monday, February 27, 2006

7 Organizational Obstacles to Marketing Measurement

Effective marketing measurement on a strategic (vs. tactical) level is undermined by seven common organizational mistakes. See which ones pertain to you.


  1. Setting performance metrics beyond the span of control: Keeping everyone’s eye on the bottom line is good. Linking too much of their bonus or merit consideration to key performance indicators based on financial outcomes too far removed from marketing influence, isn’t. It often results in a demoralized marketing team that is resentful of other functional departments and less likely to seek input or build consensus when it comes to strategy development, program execution, or measurement.

  2. Letting the metrics become the objectives: One of the big automotive components suppliers challenged its team to build a car-door hinge system that was significantly more smooth and quiet than the current approach. They succeeded. But, the cost per door tripled. If you’ve hired smart people, be careful how you state their objectives. They will find a way to achieve them.
  3. Impeding the flow of bad news: Metrics in marketing won’t work unless they promote objectivity — which means accepting the bad with the good. Equating reward solely with success sends the clear signal that being the messenger is a good way to get shot unless all the news is good. Find subtle ways to reward truth along with success, and link the two together in the minds of your team.

  4. Delegating measurement strategy: In selecting the right marketing metrics, the decision maker has to have not only a big-picture perspective, but the clout to negotiate marketing’s new science with the rest of the organization. Mid-level managers can’t do this. Only a person at the top can assess how much change marketing can take in one step and in which direction the group must move. Plus, when measurement strategy is delegated, truth and insight often take a back seat to rationalization and justification. Measurement requires leadership that ensures that every person in the organization is focused on being creative, being supportive, taking initiative, and performing as a team player. Appointing a trusted staff member to be the chief of the measurement police is a sure way to cut them out of the informal communications channels where the real information is shared. You may decide to have someone coordinate the process, but the actual measurement (and results) should be owned by a broad group of marketing leaders, chief among them the CMO.

  5. Allowing IT to control the agenda: In an increasingly data-driven marketing era, IT is responsible for collecting and storing data, mining customer transaction files, and sending and receiving messages in record time. Consequently the path to progress in marketing measurement is often dependent upon the same time- and resource-starved IT people who support all the other mission-critical company functions. But the prioritization of those IT resources is most often made with an eye toward fixing holes in cash-flow management or operations support, not marketing process improvement. Consequently, marketing must be prepared to present its case by simultaneously forecasting the business value of the proposed changes and the cost of outsourcing the work. In larger marketing organizations, it often makes sense to have an IT liaison on the marketing team whose responsibility includes the mid- and long-range planning of company IT capabilities to support marketing evolution and to translate the inevitable “we can’t do that” IT response into creative solutions for progress.

  6. Neglecting to give researchers and analysts respect: When was the last time you met a CMO who rose up through research? Researchers and analysts typically live at the lower end of the marketing pay scales and often have no career path. They need to act as thought leaders within the organization, leveraging the thought and data models they build in marketing and in all of the business functions it touches. When researchers rise as thought leaders, they encourage the use of facts and data to make smart decisions. So the smart CMO will see that these people get the training in communications skills and leadership development to expose their talents more broadly and spread that discipline within the department. It’s time to rethink the role of research and decision analytics in our marketing structures, not just expand on the same old models.

  7. Forgetting about training in measurement: And we wonder why we hear so much complaining about skill shortages. Survey after survey on improving marketing measurement cites the No. 1 CMO need as “getting the right skills in place.” But by our observation, fewer than one in 10 mid-to-large-sized marketing departments have comprehensive skill-building programs.
Each and every one of these common symptoms is sufficient to block progress in achieving measurement synthesis horizontally across the marketing organization. Only when we start breaking down these barriers will we begin to see the “big picture” of marketing performance in the context of the whole company’s continuous improvement plan.

Monday, February 20, 2006

Ideas for Channel Management Metrics

If you have various distribution channels for your products, then your success is largely dependent upon the strength of those channels. The right channel metrics can monitor your progress at shaping, influencing, and managing your business to ensure the end customer is getting the best brand experience and you are getting the best return on your channel investments. Here are a few potential channel metrics to consider.


Channel Coverage
If you’re selling wireless phones through independent retailers, you’ll want to make sure you’re covering all the places where people are buying those phones. Companies that manage their distribution chains contractually — through independent agents, sales representatives, or other partners that help them get business done — can get clarity on prospect reach and market penetration from a dashboard metric on this issue. It can be even more forward-looking if coverage incorporates prospective channel partners in various stages of finalizing agreements and building out facilities.

Channel Relationship Mix
With the level of decentralization and outsourcing in business today, companies may not have full control over the players who staff their distribution channels downstream. Major oil companies like Shell and ExxonMobil don’t manage every stop on their distribution chains anymore, but they still have to keep track of how their products are selling at the consumer level. Monitoring the evolving mix of channel relationship types helps to keep the focus on the strategic importance of channel leverage strategies.

Relative Channel Performance
When you have multiple types of channels, you can often structure ways to look at marketing returns by channel — which gives you a view toward opportunities to optimize investments across channels. You might, for example, find that the cost-per-sale in one channel is significantly lower than the others. This raises the question of how much more money could be spent in selling through that channel before the returns begin to diminish (an optimization challenge). Monitoring these relative channel performance measures can provoke key questions about how resources are being allocated and help forecast the need for revitalizing efforts or planning capital investments.

Channel Stock Positions
Stock-outs can be a critically limiting factor to growth. Customers get annoyed when they go out of their way to come in only to find you’re out of something they think you should have. The loss can be permanent. If monitoring and forecasting in- and out-of-stock ratios is crucial to your business, then it’s relevant for your dashboard. The forward-looking component of this measurement relies on good sales forecasting to help you spot problems with your inventory before they happen. It can also help you better manage the range of merchandise you carry and watch your inventory turns more closely.


Channel Perceptions of Marketing
There’s been very little dashboard activity in this area to date, but this is a measurement category worthy of careful consideration. Many of the same companies that spend millions on research to understand customer and employee views spend nothing on capturing channel perspectives. This is not only crucial to businesses like fast food franchisors and automobile manufacturers who must coordinate local marketing activity with regional co-ops of franchisees, but can be equally important to manufacturers of all types selling through Lowe’s, Target, or other retailers for which the opinions of the category buyers and the sales floor associates can make or break marketing effectiveness. It’s also important to industries that distribute through agent networks, wholesalers, or independent sales organizations.

Channel Power Measures
There are a number of different ways you can measure channel power, but the most compelling is how much margin you’re keeping vs. your channel partners. If the markup to the final consumer is greater than the wholesale markup, it stands to reason that you have ceded some significant power to the channel. Reclaiming some of that margin is a worthy pursuit for marketing and monitoring and forecasting channel power gives you some sense of how effective you are at changing bottom-line performance through brand building or product innovation.


These are just a few examples of how you might better reflect channel performance in your business and manage towards target goals. The old saying that "if you can't measure it, you can't manage it" might never have been more true than with respect to channel management.

Thursday, February 09, 2006

Hierarchy of Effects - BS or Baseline?

Over 100 years ago, marketers first conceived a model for consumer purchasing behavior. Originally, it was suggested to be a very simple model of four stages:

Awareness › Interest › Desire › Action

In the 1960s, the model was refined and relabeled as the Hierarchy of Effects (HOE), founded upon the assumption of a three-stage process underlying consumer purchase behavior:
Cognition › Affect › Behavior

“Cognition” represented the process of becoming specifically aware of a solution to fit one’s need; “affect” was the process of becoming emotionally engaged in the purchase; and “behavior” was the resulting purchase.

Over the past 40 years, all this has proven time and again to be wrong. So why is it still potentially so valuable?

The HOE model may be right for some categories and some consumers at some points in time, but it fails miserably as a predictor of how most people buy in most categories most of the time. It assumes a sequential linearity of the buying process that just doesn't hold in many (if not most) occasions. True, you are unlikely to buy something you are not aware of. But, you might just become aware of it by seeing it on the shelf at the checkout counter and decide, on impulse, to pick it up. No emotional bonding required.

But the real value of the HOE model to marketers isn’t in its accuracy as much as its existence. The mere fact that we have such a model as a starting point to begin to consider how our own categories work is very valuable. Diagnosing the linear or non-linear stages of progression amongst our own customers can be highly beneficial in forcing us to think “outside-in” from the customer perspective. It encourages us to map out the models that work in our own business, see where the critical prospect/customer progressions might be, and better understand what causes those progressions to work or what obstacles prevent them.

HOE is also a good starting point for defining and dimensionalizing segmentation strategies. If you can identify certain types of customers who employ variants of the HOE model in making their purchases, you have by definition identified discrete segments which might be targetable through efficient, albeit very different means.

Finally, HOE as a starting point helps facilitate the discussion about critical predictive metrics for measurement purposes. If you can describe and validate the buying model for a given segment of customers, it stands to reason that by closely monitoring the stage-gates at the front-end of the cycle you might reasonably predict the resulting levels of purchase behavior and a timeframe for their occurance.


Have you identified your customer progression points? How did you begin the process? Share your thoughts …

Monday, January 30, 2006

Brand Value vs. Brand Valuation

There’s a difference between “brand value” and “brand valuation.” Brand value is the strategic and financial value of the brand to your company today. Brand valuation is a financial exercise intended to put a price on the brand over and above the discounted future cash flows. The difference can be subtle. Tim Ambler of the London Business School uses this metaphor to describe the two: “Since I live in my house and plan to do so for some time, its value to me is the shelter and comfort I derive from it. When I’m prepared to consider selling it, I’ll be interested in the valuation.” Brands work much the same way.

So when should you be looking at brand value and when should you consider brand valuation?Let’s compare the two by first looking at brand value.

Brands create value for companies in several ways:
  • They create customer loyalty, resulting in a lower cost of customer reacquisition and greater likelihood of future sales from existing customers.
  • They lower the perception of risk the company presents to the financial marketplace, resulting in lower borrowing or financing costs.
  • They establish negotiating leverage with suppliers and vendors who seek to be associated with them.
  • They establish the perception of continuity of cash flows into the future amongst investors, thereby increasing the multiple over the company book value that investors are willing to pay for stock.

If these dimensions of brand value are relevant ways for you to gauge the potential return you will create by investing in brand development activities, then you’d benefit by reporting them on a brand scorecard. You may choose to reflect it in competitive comparisons of expected customer lifetime value, perceptions of company “quality” amongst investors and analysts (either through syndicated methods like CoreBrand® or through proprietary research among targeted analysts), an index of company borrowing costs that isolates brand contributions from other marketplace and company variables, or a survey of brand influence within the vendor community.

The most common measure of brand value is one of the difference between market capitalization and either “book value” — the value of the company’s total balance sheet assets — or the net present value of expected future cash flows. Unfortunately, it’s not often reasonable to assume that the difference is mostly attributable to brand value. Channel dominance, patents and technical advantages, sales force effectiveness, and other non-brand elements can be responsible for a big portion of the “intangible” value of the company.

Nevertheless, if your category is one in which investments in brand development are less directly justifiable in terms of customer financial behavior in the near term, you may need to incorporate some element of brand value in your analysis. The best advice we can offer is to sit down with your CFO and discuss the ways you might agree on measuring the brand asset. Typically those fall into two classes. The first is made up of top-down models that seek to explain valuation in terms of the lift in share price that the brand gives you over and above what the company would trade at without a brand. The second approach comes at it from the bottom up. Often called the “economic use” approach, this is an attempt to measure how much incremental cash flow the brand provides over and above what you would get with a “generic” product. The two are philosophically very well aligned. One comes from the macro and hopes to explain the micro, and the other hopes to aggregate the micro to explain superior valuation for the company.

“Brand valuation,” on the other hand, may be relevant to you if your portfolio of brands includes some acquired from other companies, or if you anticipate selling one or more brands at some point in the not-too-distant future.

Accounting regulations in the United States and many other countries require companies to keep close tabs on the “goodwill” assets they carry on their balance sheets from past acquisitions. If the CFO has reason to believe that any acquired brand is no longer worth its carrying value on the balance sheet, she must take a write-down against earnings on the P&L to revise the estimate of value in a process called “asset impairment.”

As a result, companies with acquired brands often need to continually monitor the value of those brands on their brand scorecard to prevent any sudden surprises in earnings.

Similarly, if your company anticipates selling itself in the whole or just selling one or more brands in its portfolio, you may want to begin tracking brand valuation over the period leading up to the sale to understand which potential investments help increase the valuation and which might actually detract from it.

Bottom line: if your primary interest is in measuring the strategic development of brand equity, don't waste time with brand valuation.

Monday, January 23, 2006

Organizational Metrics - Often Overlooked

With most dashboards focused on programatic performance and creation of economic value, it's not hard to understand why critical organizational metrics are often forgotten and left off.

Most large companies spend significant amounts of money on recruiting, training, and developing people in pursuit of productivity and growth. They engage training companies or universities to develop curriculum to improve the specifically desired skills either broadly across the marketing organization or in narrow functional pockets. It's only logical that if the desired outcomes are intended to create economic value, we should consider them to be just like any other element of the marketing mix and measure them on our dashboard.

Using the dashboard to monitor the percentage of your target employees that have achieved the requisite level of training, education, certification, or skill proficiency is mission critical and very appropriate. Succession eligibility is another useful metric for the overall health of the organization. There are two ways to view succession eligibility: first, as the percentage of your senior staff who have groomed replacements ready to step in for them; or second, as the overall percentage of marketing staff who are ready to step up to the next job if they had to. Either of these can be presented in stages of readiness ranging from not-at-all to ready-to-go, which will give you a more dimensional feeling for the progress your organization
is making.


If success in your organization is directly related to employee proficiency and satisfaction, then monitoring employee feedback on your dashboard can be a terrific leading indicator. Many organizations have formal voice of the employee (VOE) programs that survey the employee population frequently on their knowledge, understanding, and enthusiasm for the company’s mission and strategy. Others choose to measure overall job satisfaction in the form of likelihood of referring a friend or family member to buy from or work for the company in the next 90 days. These make strong dashboard metrics to the degree they can be correlated to marketplace success.

Like other metric categories, the key is trying to isolate the most relevant and predictive measures and then working to validate them over time. Just by tracking and featuring many of the prominent organizational evolution goals, you'll be sending the message that you are as committed to achieving them as you are to other marketplace outcomes.

Monday, January 16, 2006

Can You Legitimately Manufacture Data You Need?

Aside from a few purely direct-response businesses like catalog retailing, there is no business today capable of completely and comprehensively measuring marketing effectiveness without some doubt. Even the soundest efforts require that significant assumptions be made to fill the gaps in the data or deal with the uncertainties of dynamic markets, such as:
  • How will competitors react if we do X?
  • Will distributors increase or decrease support?
  • What are commodity prices likely to do?

Decisions based on observable, validated data are usually the best ones. When you have the data, use it. If you’re lucky enough to have the right data in the right quantities for the question at hand, then let your analytical scientists drive and put your instincts in the passenger seat long enough to watch and learn.

But when you don’t have the data and you can’t buy it or develop a clear proxy for it from some other source, you still need to know how to make the decision. Sometimes, you might need to actually make the data. That probably sounds heretical to many of you who’ve invested a great deal of money and energy in beefing up your analytical capabilities. But where the analytics leave off and the questions linger, we succeed or fail by the quality of our guesses.

The one approach for developing data proxies we've used with good success is response modeling, a tool that can help you make better guesses by talking to people with the right experience.

Response modeling in its simplest terms, requires assembling a group of people in your organization whom you believe have the experience to make sound educated guesses on specific issues you want to track. The process involves walking the group through a series of structured question-and-answer sessions — essentially completing a response card — in which you ask each of them very specific questions that zero in on one or more areas of uncertainty.

You might ask a group to predict where a certain product is going to be 12 months from now, then ask them to break that prediction down on a month-by-month basis. Then you ask a series of questions designed to uncover the drivers of the outcome and the relationships between the variables. For example:

  • What would happen to sales if we doubled our advertising?

  • What would happen if we cut it in half?

  • What if we see one or two competitors flood our space with similar products?

  • Based on that situation, what would we see if we doubled our advertising spend? Cut it in half?
During the series of meetings, the group thrashes out the most likely scenarios and debates the answers to these structured questions and the assumptions underlying them. Consensus is NOT necessary. Just peer-reviewed perspectives. The responses then get entered into a computer model and are translated into a curve that expresses the range of variability of the uncertain element and its sensitivity to other variables.

Example: If every manager were asked about the likely effect on profits if advertising were increased by 25%, it would produce a spectrum of possible outcomes from “no effect” (or maybe even “modest decrease”) to “modest increase” to “significant increase.” Those outcomes could be plotted on a curve to show the range of expected outcomes.

Now if we asked for expectations for a 25% decrease, we could also plot those. And if we continued both up and down to 50%, 75%, and 100% increases, as well as 50%, 75%, and 100% decreases, we’d have a pretty clear set of predictions that we could statistically translate into a response model.

If we wanted to get more complex, we could ask the same group to predict the outcome of simultaneously changing advertising spend and changing direct mail. Human beings with experience in the business will use their knowledge and intuition to develop individual best-guess outcomes. The matrix might look like this:


In other words, the collective perspectives of the brightest minds in the company, especially those that disagree on likely outcomes, create a universe of possible outcomes that can be represented by a mathematical algorithm that says for every change of x%+/- in ad spend, profits will change +/-y%.

The model you create represents the collective tribal wisdom on a particular issue that might otherwise be tough to turn into a metric because you don’t have the data. Response models are really nothing more than a highly structured way of helping a management team direct its experience into an aggregated best guess. This may seem unpredictable, but in reality it helps identify the subtle relationships between actions and outcomes while removing some of the risk of any single individual being wildly wrong.

Every manager can form an opinion on the likely result of a certain action or inaction solely on the basis of their experience. The cumulative experience base within a company is often the most powerful untapped data source. Harnessing those individual perspectives into a collective view often provides tremendous insight helpful in making hard decisions. Of course, this approach is vulnerable to bad guessing by the entire group (which would be the Achilles heel of the company anyway), or even to sabotage by those who have an axe to grind against a certain form of spending. But if your group is diverse enough, it’s not hard to minimize these risks and improve the quality of the outcome.

Monday, January 09, 2006

Does Too Much Measurement Constrain Creativity?

Does a comprehensive marketing measurement framework impinge upon the very creativity and innovation marketing needs to provide to the organization? I suppose the answer is, "it depends".

Thomas W. Malone, professor of management at MIT’s Sloan School of Management, has spent the better part of a long academic career researching organizational effectiveness. In his book, The Future of Work: How the New Order of Business Will Shape Your Organization, Your Management Style, and Your Life, Malone points to a “paradox of standards.” He says clearly and firmly defining a few rules (controls) in the most risky areas of the organization sets creativity free in all others.

For example, eBay doesn’t “control” much of what happens on its vast global network. It allows buyers and sellers to interact as they will. What makes the network so successful is the clear framework of rules (the exclusion of certain product categories and bidding processes, for example) that are just firm enough to protect the interests of the greater good and no more restrictive. Certainly no one would accuse eBay of stifling creativity that inhibits growth.

Marketers have long understood this paradox in key efforts like ad copy briefs. Decades of experience have shown that the best creative briefs focus succinctly on a distinct business objective and impose as few firm parameters as possible, but do include some. The creatives must work within the parameters to find new dimensions of communications effectiveness that achieve the business goal. Apply too many parameters, and you’ll get boring, uninspired copy unlikely to accomplish its mission of persuasion. Define too few, and the ads diverge from the strategy, unlikely to create the desired attitudinal or behavioral shifts.

This is how Malone’s “paradox” works. The better defined the playing field is, the more likely the result will be a win. Finding the right balance between objective definition and subjective interpretation is the difference between winning and losing.

But achieving this balance is certainly not easy in the explosive complexity of today’s marketing organization. Several companies who have made good progress report that their success came from evolving from a command-and-control structure to one focused on defining the right set of controls and then applying all energies to drawing the best out of more autonomous, decentralized operating groups.

McDonald’s, for example, has employed a “flexible framework” to deal with the hundreds of customer segments it serves worldwide, across dozens of cultures. To rebuild its brand relevancy after several years of sales attrition, McDonald’s required that communications be open, honest, and fully transparent while speaking in the consumer’s own voice. Beyond that, McDonald’s sets firm expectations for business outcomes and lets the creative process interpret the brand in each culture in ways most appealing to the local customer.

The learning here seems to be that if you choose the right metrics, your measurement framework might actually enhance creativity and innovation by helping to focus them. But the converse is also likely to be true... if your approach to measurement simply reinforces the parameters that constrain the business today, you might very well be accelerating the cycle of monotony.

It might be worthwhile to think about that when you're considering the hundreds of possible dashboard metrics people might want to stuff on the dashboard.

Monday, January 02, 2006

Winning the Guessing Game

Despite all the hand-wringing over marketing getting "a seat at the boardroom table," the irreversible trend we’re seeing in measurement of marketing effectiveness has improved both the return on marketing expenditures and the credibility of the marketing function within the corporation. Database technology, analytics, and Web presentation tools have all contributed to an unstoppable wave of desire to understand and quantify the impact of marketing expenditures on the company’s bottom line. All this is unquestionably for the better.

But there's a much bigger game being played out in corporate boardrooms, one in which dashboards are performing a critically important function. And sometimes marketers get so wrapped up in the financial and statistical orgy of metrics they lose sight of the true competitive advantage afforded by an effective marketing dashboard.

You see, the things that are countable can be counted by anyone. Given similar resources, competitors will always achieve parity with respect to the foundational elements of statistical analysis and optimization. Everyone will soon have their own media-mix model, and portfolio management of ROI will become the de facto standard for how marketing resources are allocated.

But what can truly separate us from our competitors and deliver exploitable marketplace advantage is not being better counters, but becoming better guessers.

Guessing is what we do when we don’t have enough information to be certain about the likely outcome of a decision — which is most of the time.

There’s a strange correlation between the potential magnitude of the risk of a given decision and the propensity to have to guess. The two are directly proportional. That’s why people still manage companies and computers just provide “decision support.”

I've seen effective marketing dashboards facilitate a better guessing organization in two ways:

  1. By assembling the relevant information in a form and manner that improves the ability of the human mind to find the synaptic links between previously unrelated elements and see patterns where no numerical analysis has.

  2. By providing a “learning loop” to rapidly test assumptions (a.k.a. “guesses”) against observable facts to enhance the quality of the decisions in the face of uncertainty.

In a world of rapid assimilation of information, it’s the development of proprietary insights that will distinguish one company from another. Insights can start out as just “guesses” but, through tools like the marketing dashboard, rapidly evolve to become known facts long before the competitors ever figure it out.