- Setting performance metrics beyond the span of control: Keeping everyone’s eye on the bottom line is good. Linking too much of their bonus or merit consideration to key performance indicators based on financial outcomes too far removed from marketing influence, isn’t. It often results in a demoralized marketing team that is resentful of other functional departments and less likely to seek input or build consensus when it comes to strategy development, program execution, or measurement.
- Letting the metrics become the objectives: One of the big automotive components suppliers challenged its team to build a car-door hinge system that was significantly more smooth and quiet than the current approach. They succeeded. But, the cost per door tripled. If you’ve hired smart people, be careful how you state their objectives. They will find a way to achieve them.
- Impeding the flow of bad news: Metrics in marketing won’t work unless they promote objectivity — which means accepting the bad with the good. Equating reward solely with success sends the clear signal that being the messenger is a good way to get shot unless all the news is good. Find subtle ways to reward truth along with success, and link the two together in the minds of your team.
- Delegating measurement strategy: In selecting the right marketing metrics, the decision maker has to have not only a big-picture perspective, but the clout to negotiate marketing’s new science with the rest of the organization. Mid-level managers can’t do this. Only a person at the top can assess how much change marketing can take in one step and in which direction the group must move. Plus, when measurement strategy is delegated, truth and insight often take a back seat to rationalization and justification. Measurement requires leadership that ensures that every person in the organization is focused on being creative, being supportive, taking initiative, and performing as a team player. Appointing a trusted staff member to be the chief of the measurement police is a sure way to cut them out of the informal communications channels where the real information is shared. You may decide to have someone coordinate the process, but the actual measurement (and results) should be owned by a broad group of marketing leaders, chief among them the CMO.
- Allowing IT to control the agenda: In an increasingly data-driven marketing era, IT is responsible for collecting and storing data, mining customer transaction files, and sending and receiving messages in record time. Consequently the path to progress in marketing measurement is often dependent upon the same time- and resource-starved IT people who support all the other mission-critical company functions. But the prioritization of those IT resources is most often made with an eye toward fixing holes in cash-flow management or operations support, not marketing process improvement. Consequently, marketing must be prepared to present its case by simultaneously forecasting the business value of the proposed changes and the cost of outsourcing the work. In larger marketing organizations, it often makes sense to have an IT liaison on the marketing team whose responsibility includes the mid- and long-range planning of company IT capabilities to support marketing evolution and to translate the inevitable “we can’t do that” IT response into creative solutions for progress.
- Neglecting to give researchers and analysts respect: When was the last time you met a CMO who rose up through research? Researchers and analysts typically live at the lower end of the marketing pay scales and often have no career path. They need to act as thought leaders within the organization, leveraging the thought and data models they build in marketing and in all of the business functions it touches. When researchers rise as thought leaders, they encourage the use of facts and data to make smart decisions. So the smart CMO will see that these people get the training in communications skills and leadership development to expose their talents more broadly and spread that discipline within the department. It’s time to rethink the role of research and decision analytics in our marketing structures, not just expand on the same old models.
- Forgetting about training in measurement: And we wonder why we hear so much complaining about skill shortages. Survey after survey on improving marketing measurement cites the No. 1 CMO need as “getting the right skills in place.” But by our observation, fewer than one in 10 mid-to-large-sized marketing departments have comprehensive skill-building programs.
Monday, February 27, 2006
7 Organizational Obstacles to Marketing Measurement
Effective marketing measurement on a strategic (vs. tactical) level is undermined by seven common organizational mistakes. See which ones pertain to you.


Monday, February 20, 2006
Ideas for Channel Management Metrics
If you have various distribution channels for your products, then your success is largely dependent upon the strength of those channels. The right channel metrics can monitor your progress at shaping, influencing, and managing your business to ensure the end customer is getting the best brand experience and you are getting the best return on your channel investments. Here are a few potential channel metrics to consider.
Channel Coverage
If you’re selling wireless phones through independent retailers, you’ll want to make sure you’re covering all the places where people are buying those phones. Companies that manage their distribution chains contractually — through independent agents, sales representatives, or other partners that help them get business done — can get clarity on prospect reach and market penetration from a dashboard metric on this issue. It can be even more forward-looking if coverage incorporates prospective channel partners in various stages of finalizing agreements and building out facilities.
Channel Relationship Mix
With the level of decentralization and outsourcing in business today, companies may not have full control over the players who staff their distribution channels downstream. Major oil companies like Shell and ExxonMobil don’t manage every stop on their distribution chains anymore, but they still have to keep track of how their products are selling at the consumer level. Monitoring the evolving mix of channel relationship types helps to keep the focus on the strategic importance of channel leverage strategies.
Relative Channel Performance
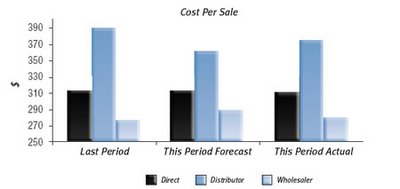
When you have multiple types of channels, you can often structure ways to look at marketing returns by channel — which gives you a view toward opportunities to optimize investments across channels. You might, for example, find that the cost-per-sale in one channel is significantly lower than the others. This raises the question of how much more money could be spent in selling through that channel before the returns begin to diminish (an optimization challenge). Monitoring these relative channel performance measures can provoke key questions about how resources are being allocated and help forecast the need for revitalizing efforts or planning capital investments.
Channel Stock Positions
Stock-outs can be a critically limiting factor to growth. Customers get annoyed when they go out of their way to come in only to find you’re out of something they think you should have. The loss can be permanent. If monitoring and forecasting in- and out-of-stock ratios is crucial to your business, then it’s relevant for your dashboard. The forward-looking component of this measurement relies on good sales forecasting to help you spot problems with your inventory before they happen. It can also help you better manage the range of merchandise you carry and watch your inventory turns more closely.
Channel Perceptions of Marketing
There’s been very little dashboard activity in this area to date, but this is a measurement category worthy of careful consideration. Many of the same companies that spend millions on research to understand customer and employee views spend nothing on capturing channel perspectives. This is not only crucial to businesses like fast food franchisors and automobile manufacturers who must coordinate local marketing activity with regional co-ops of franchisees, but can be equally important to manufacturers of all types selling through Lowe’s, Target, or other retailers for which the opinions of the category buyers and the sales floor associates can make or break marketing effectiveness. It’s also important to industries that distribute through agent networks, wholesalers, or independent sales organizations.
Channel Power Measures
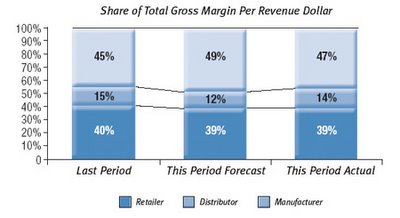
There are a number of different ways you can measure channel power, but the most compelling is how much margin you’re keeping vs. your channel partners. If the markup to the final consumer is greater than the wholesale markup, it stands to reason that you have ceded some significant power to the channel. Reclaiming some of that margin is a worthy pursuit for marketing and monitoring and forecasting channel power gives you some sense of how effective you are at changing bottom-line performance through brand building or product innovation.
Channel Coverage
If you’re selling wireless phones through independent retailers, you’ll want to make sure you’re covering all the places where people are buying those phones. Companies that manage their distribution chains contractually — through independent agents, sales representatives, or other partners that help them get business done — can get clarity on prospect reach and market penetration from a dashboard metric on this issue. It can be even more forward-looking if coverage incorporates prospective channel partners in various stages of finalizing agreements and building out facilities.
Channel Relationship Mix
With the level of decentralization and outsourcing in business today, companies may not have full control over the players who staff their distribution channels downstream. Major oil companies like Shell and ExxonMobil don’t manage every stop on their distribution chains anymore, but they still have to keep track of how their products are selling at the consumer level. Monitoring the evolving mix of channel relationship types helps to keep the focus on the strategic importance of channel leverage strategies.
Relative Channel Performance
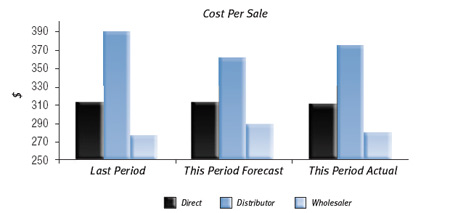
When you have multiple types of channels, you can often structure ways to look at marketing returns by channel — which gives you a view toward opportunities to optimize investments across channels. You might, for example, find that the cost-per-sale in one channel is significantly lower than the others. This raises the question of how much more money could be spent in selling through that channel before the returns begin to diminish (an optimization challenge). Monitoring these relative channel performance measures can provoke key questions about how resources are being allocated and help forecast the need for revitalizing efforts or planning capital investments.
Channel Stock Positions
Stock-outs can be a critically limiting factor to growth. Customers get annoyed when they go out of their way to come in only to find you’re out of something they think you should have. The loss can be permanent. If monitoring and forecasting in- and out-of-stock ratios is crucial to your business, then it’s relevant for your dashboard. The forward-looking component of this measurement relies on good sales forecasting to help you spot problems with your inventory before they happen. It can also help you better manage the range of merchandise you carry and watch your inventory turns more closely.
Channel Perceptions of Marketing
There’s been very little dashboard activity in this area to date, but this is a measurement category worthy of careful consideration. Many of the same companies that spend millions on research to understand customer and employee views spend nothing on capturing channel perspectives. This is not only crucial to businesses like fast food franchisors and automobile manufacturers who must coordinate local marketing activity with regional co-ops of franchisees, but can be equally important to manufacturers of all types selling through Lowe’s, Target, or other retailers for which the opinions of the category buyers and the sales floor associates can make or break marketing effectiveness. It’s also important to industries that distribute through agent networks, wholesalers, or independent sales organizations.
Channel Power Measures
There are a number of different ways you can measure channel power, but the most compelling is how much margin you’re keeping vs. your channel partners. If the markup to the final consumer is greater than the wholesale markup, it stands to reason that you have ceded some significant power to the channel. Reclaiming some of that margin is a worthy pursuit for marketing and monitoring and forecasting channel power gives you some sense of how effective you are at changing bottom-line performance through brand building or product innovation.

These are just a few examples of how you might better reflect channel performance in your business and manage towards target goals. The old saying that "if you can't measure it, you can't manage it" might never have been more true than with respect to channel management.
Thursday, February 09, 2006
Hierarchy of Effects - BS or Baseline?
Over 100 years ago, marketers first conceived a model for consumer purchasing behavior. Originally, it was suggested to be a very simple model of four stages:
Awareness › Interest › Desire › Action
In the 1960s, the model was refined and relabeled as the Hierarchy of Effects (HOE), founded upon the assumption of a three-stage process underlying consumer purchase behavior:
Cognition › Affect › Behavior
“Cognition” represented the process of becoming specifically aware of a solution to fit one’s need; “affect” was the process of becoming emotionally engaged in the purchase; and “behavior” was the resulting purchase.
Over the past 40 years, all this has proven time and again to be wrong. So why is it still potentially so valuable?
The HOE model may be right for some categories and some consumers at some points in time, but it fails miserably as a predictor of how most people buy in most categories most of the time. It assumes a sequential linearity of the buying process that just doesn't hold in many (if not most) occasions. True, you are unlikely to buy something you are not aware of. But, you might just become aware of it by seeing it on the shelf at the checkout counter and decide, on impulse, to pick it up. No emotional bonding required.
But the real value of the HOE model to marketers isn’t in its accuracy as much as its existence. The mere fact that we have such a model as a starting point to begin to consider how our own categories work is very valuable. Diagnosing the linear or non-linear stages of progression amongst our own customers can be highly beneficial in forcing us to think “outside-in” from the customer perspective. It encourages us to map out the models that work in our own business, see where the critical prospect/customer progressions might be, and better understand what causes those progressions to work or what obstacles prevent them.
HOE is also a good starting point for defining and dimensionalizing segmentation strategies. If you can identify certain types of customers who employ variants of the HOE model in making their purchases, you have by definition identified discrete segments which might be targetable through efficient, albeit very different means.
Finally, HOE as a starting point helps facilitate the discussion about critical predictive metrics for measurement purposes. If you can describe and validate the buying model for a given segment of customers, it stands to reason that by closely monitoring the stage-gates at the front-end of the cycle you might reasonably predict the resulting levels of purchase behavior and a timeframe for their occurance.
Have you identified your customer progression points? How did you begin the process? Share your thoughts …
Monday, January 30, 2006
Brand Value vs. Brand Valuation
There’s a difference between “brand value” and “brand valuation.” Brand value is the strategic and financial value of the brand to your company today. Brand valuation is a financial exercise intended to put a price on the brand over and above the discounted future cash flows. The difference can be subtle. Tim Ambler of the London Business School uses this metaphor to describe the two: “Since I live in my house and plan to do so for some time, its value to me is the shelter and comfort I derive from it. When I’m prepared to consider selling it, I’ll be interested in the valuation.” Brands work much the same way.
So when should you be looking at brand value and when should you consider brand valuation?Let’s compare the two by first looking at brand value.
Brands create value for companies in several ways:
So when should you be looking at brand value and when should you consider brand valuation?Let’s compare the two by first looking at brand value.
Brands create value for companies in several ways:
- They create customer loyalty, resulting in a lower cost of customer reacquisition and greater likelihood of future sales from existing customers.
- They lower the perception of risk the company presents to the financial marketplace, resulting in lower borrowing or financing costs.
- They establish negotiating leverage with suppliers and vendors who seek to be associated with them.
- They establish the perception of continuity of cash flows into the future amongst investors, thereby increasing the multiple over the company book value that investors are willing to pay for stock.
If these dimensions of brand value are relevant ways for you to gauge the potential return you will create by investing in brand development activities, then you’d benefit by reporting them on a brand scorecard. You may choose to reflect it in competitive comparisons of expected customer lifetime value, perceptions of company “quality” amongst investors and analysts (either through syndicated methods like CoreBrand® or through proprietary research among targeted analysts), an index of company borrowing costs that isolates brand contributions from other marketplace and company variables, or a survey of brand influence within the vendor community.
The most common measure of brand value is one of the difference between market capitalization and either “book value” — the value of the company’s total balance sheet assets — or the net present value of expected future cash flows. Unfortunately, it’s not often reasonable to assume that the difference is mostly attributable to brand value. Channel dominance, patents and technical advantages, sales force effectiveness, and other non-brand elements can be responsible for a big portion of the “intangible” value of the company.
Nevertheless, if your category is one in which investments in brand development are less directly justifiable in terms of customer financial behavior in the near term, you may need to incorporate some element of brand value in your analysis. The best advice we can offer is to sit down with your CFO and discuss the ways you might agree on measuring the brand asset. Typically those fall into two classes. The first is made up of top-down models that seek to explain valuation in terms of the lift in share price that the brand gives you over and above what the company would trade at without a brand. The second approach comes at it from the bottom up. Often called the “economic use” approach, this is an attempt to measure how much incremental cash flow the brand provides over and above what you would get with a “generic” product. The two are philosophically very well aligned. One comes from the macro and hopes to explain the micro, and the other hopes to aggregate the micro to explain superior valuation for the company.
“Brand valuation,” on the other hand, may be relevant to you if your portfolio of brands includes some acquired from other companies, or if you anticipate selling one or more brands at some point in the not-too-distant future.
Accounting regulations in the United States and many other countries require companies to keep close tabs on the “goodwill” assets they carry on their balance sheets from past acquisitions. If the CFO has reason to believe that any acquired brand is no longer worth its carrying value on the balance sheet, she must take a write-down against earnings on the P&L to revise the estimate of value in a process called “asset impairment.”
As a result, companies with acquired brands often need to continually monitor the value of those brands on their brand scorecard to prevent any sudden surprises in earnings.
Similarly, if your company anticipates selling itself in the whole or just selling one or more brands in its portfolio, you may want to begin tracking brand valuation over the period leading up to the sale to understand which potential investments help increase the valuation and which might actually detract from it.
Bottom line: if your primary interest is in measuring the strategic development of brand equity, don't waste time with brand valuation.
Monday, January 23, 2006
Organizational Metrics - Often Overlooked
With most dashboards focused on programatic performance and creation of economic value, it's not hard to understand why critical organizational metrics are often forgotten and left off.
Most large companies spend significant amounts of money on recruiting, training, and developing people in pursuit of productivity and growth. They engage training companies or universities to develop curriculum to improve the specifically desired skills either broadly across the marketing organization or in narrow functional pockets. It's only logical that if the desired outcomes are intended to create economic value, we should consider them to be just like any other element of the marketing mix and measure them on our dashboard.
Using the dashboard to monitor the percentage of your target employees that have achieved the requisite level of training, education, certification, or skill proficiency is mission critical and very appropriate. Succession eligibility is another useful metric for the overall health of the organization. There are two ways to view succession eligibility: first, as the percentage of your senior staff who have groomed replacements ready to step in for them; or second, as the overall percentage of marketing staff who are ready to step up to the next job if they had to. Either of these can be presented in stages of readiness ranging from not-at-all to ready-to-go, which will give you a more dimensional feeling for the progress your organization
is making.
Most large companies spend significant amounts of money on recruiting, training, and developing people in pursuit of productivity and growth. They engage training companies or universities to develop curriculum to improve the specifically desired skills either broadly across the marketing organization or in narrow functional pockets. It's only logical that if the desired outcomes are intended to create economic value, we should consider them to be just like any other element of the marketing mix and measure them on our dashboard.
Using the dashboard to monitor the percentage of your target employees that have achieved the requisite level of training, education, certification, or skill proficiency is mission critical and very appropriate. Succession eligibility is another useful metric for the overall health of the organization. There are two ways to view succession eligibility: first, as the percentage of your senior staff who have groomed replacements ready to step in for them; or second, as the overall percentage of marketing staff who are ready to step up to the next job if they had to. Either of these can be presented in stages of readiness ranging from not-at-all to ready-to-go, which will give you a more dimensional feeling for the progress your organization
is making.
 If success in your organization is directly related to employee proficiency and satisfaction, then monitoring employee feedback on your dashboard can be a terrific leading indicator. Many organizations have formal voice of the employee (VOE) programs that survey the employee population frequently on their knowledge, understanding, and enthusiasm for the company’s mission and strategy. Others choose to measure overall job satisfaction in the form of likelihood of referring a friend or family member to buy from or work for the company in the next 90 days. These make strong dashboard metrics to the degree they can be correlated to marketplace success.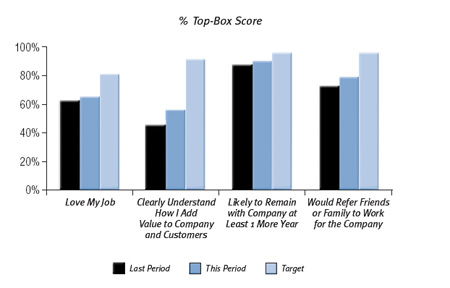
Like other metric categories, the key is trying to isolate the most relevant and predictive measures and then working to validate them over time. Just by tracking and featuring many of the prominent organizational evolution goals, you'll be sending the message that you are as committed to achieving them as you are to other marketplace outcomes.
Monday, January 16, 2006
Can You Legitimately Manufacture Data You Need?
Aside from a few purely direct-response businesses like catalog retailing, there is no business today capable of completely and comprehensively measuring marketing effectiveness without some doubt. Even the soundest efforts require that significant assumptions be made to fill the gaps in the data or deal with the uncertainties of dynamic markets, such as:
The one approach for developing data proxies we've used with good success is response modeling, a tool that can help you make better guesses by talking to people with the right experience.
Response modeling in its simplest terms, requires assembling a group of people in your organization whom you believe have the experience to make sound educated guesses on specific issues you want to track. The process involves walking the group through a series of structured question-and-answer sessions — essentially completing a response card — in which you ask each of them very specific questions that zero in on one or more areas of uncertainty.
You might ask a group to predict where a certain product is going to be 12 months from now, then ask them to break that prediction down on a month-by-month basis. Then you ask a series of questions designed to uncover the drivers of the outcome and the relationships between the variables. For example:
Example: If every manager were asked about the likely effect on profits if advertising were increased by 25%, it would produce a spectrum of possible outcomes from “no effect” (or maybe even “modest decrease”) to “modest increase” to “significant increase.” Those outcomes could be plotted on a curve to show the range of expected outcomes.
Now if we asked for expectations for a 25% decrease, we could also plot those. And if we continued both up and down to 50%, 75%, and 100% increases, as well as 50%, 75%, and 100% decreases, we’d have a pretty clear set of predictions that we could statistically translate into a response model.
If we wanted to get more complex, we could ask the same group to predict the outcome of simultaneously changing advertising spend and changing direct mail. Human beings with experience in the business will use their knowledge and intuition to develop individual best-guess outcomes. The matrix might look like this:
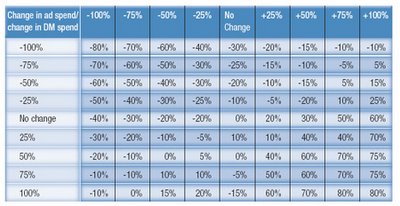 In other words, the collective perspectives of the brightest minds in the company, especially those that disagree on likely outcomes, create a universe of possible outcomes that can be represented by a mathematical algorithm that says for every change of x%+/- in ad spend, profits will change +/-y%.
The model you create represents the collective tribal wisdom on a particular issue that might otherwise be tough to turn into a metric because you don’t have the data. Response models are really nothing more than a highly structured way of helping a management team direct its experience into an aggregated best guess. This may seem unpredictable, but in reality it helps identify the subtle relationships between actions and outcomes while removing some of the risk of any single individual being wildly wrong.
Every manager can form an opinion on the likely result of a certain action or inaction solely on the basis of their experience. The cumulative experience base within a company is often the most powerful untapped data source. Harnessing those individual perspectives into a collective view often provides tremendous insight helpful in making hard decisions. Of course, this approach is vulnerable to bad guessing by the entire group (which would be the Achilles heel of the company anyway), or even to sabotage by those who have an axe to grind against a certain form of spending. But if your group is diverse enough, it’s not hard to minimize these risks and improve the quality of the outcome.
- How will competitors react if we do X?
- Will distributors increase or decrease support?
- What are commodity prices likely to do?
Decisions based on observable, validated data are usually the best ones. When you have the data, use it. If you’re lucky enough to have the right data in the right quantities for the question at hand, then let your analytical scientists drive and put your instincts in the passenger seat long enough to watch and learn.
But when you don’t have the data and you can’t buy it or develop a clear proxy for it from some other source, you still need to know how to make the decision. Sometimes, you might need to actually make the data. That probably sounds heretical to many of you who’ve invested a great deal of money and energy in beefing up your analytical capabilities. But where the analytics leave off and the questions linger, we succeed or fail by the quality of our guesses.The one approach for developing data proxies we've used with good success is response modeling, a tool that can help you make better guesses by talking to people with the right experience.
Response modeling in its simplest terms, requires assembling a group of people in your organization whom you believe have the experience to make sound educated guesses on specific issues you want to track. The process involves walking the group through a series of structured question-and-answer sessions — essentially completing a response card — in which you ask each of them very specific questions that zero in on one or more areas of uncertainty.
You might ask a group to predict where a certain product is going to be 12 months from now, then ask them to break that prediction down on a month-by-month basis. Then you ask a series of questions designed to uncover the drivers of the outcome and the relationships between the variables. For example:
- What would happen to sales if we doubled our advertising?
- What would happen if we cut it in half?
- What if we see one or two competitors flood our space with similar products?
- Based on that situation, what would we see if we doubled our advertising spend? Cut it in half?
Example: If every manager were asked about the likely effect on profits if advertising were increased by 25%, it would produce a spectrum of possible outcomes from “no effect” (or maybe even “modest decrease”) to “modest increase” to “significant increase.” Those outcomes could be plotted on a curve to show the range of expected outcomes.
Now if we asked for expectations for a 25% decrease, we could also plot those. And if we continued both up and down to 50%, 75%, and 100% increases, as well as 50%, 75%, and 100% decreases, we’d have a pretty clear set of predictions that we could statistically translate into a response model.
If we wanted to get more complex, we could ask the same group to predict the outcome of simultaneously changing advertising spend and changing direct mail. Human beings with experience in the business will use their knowledge and intuition to develop individual best-guess outcomes. The matrix might look like this:
 In other words, the collective perspectives of the brightest minds in the company, especially those that disagree on likely outcomes, create a universe of possible outcomes that can be represented by a mathematical algorithm that says for every change of x%+/- in ad spend, profits will change +/-y%.
The model you create represents the collective tribal wisdom on a particular issue that might otherwise be tough to turn into a metric because you don’t have the data. Response models are really nothing more than a highly structured way of helping a management team direct its experience into an aggregated best guess. This may seem unpredictable, but in reality it helps identify the subtle relationships between actions and outcomes while removing some of the risk of any single individual being wildly wrong.
Every manager can form an opinion on the likely result of a certain action or inaction solely on the basis of their experience. The cumulative experience base within a company is often the most powerful untapped data source. Harnessing those individual perspectives into a collective view often provides tremendous insight helpful in making hard decisions. Of course, this approach is vulnerable to bad guessing by the entire group (which would be the Achilles heel of the company anyway), or even to sabotage by those who have an axe to grind against a certain form of spending. But if your group is diverse enough, it’s not hard to minimize these risks and improve the quality of the outcome.
Monday, January 09, 2006
Does Too Much Measurement Constrain Creativity?
Does a comprehensive marketing measurement framework impinge upon the very creativity and innovation marketing needs to provide to the organization? I suppose the answer is, "it depends".
Thomas W. Malone, professor of management at MIT’s Sloan School of Management, has spent the better part of a long academic career researching organizational effectiveness. In his book, The Future of Work: How the New Order of Business Will Shape Your Organization, Your Management Style, and Your Life, Malone points to a “paradox of standards.” He says clearly and firmly defining a few rules (controls) in the most risky areas of the organization sets creativity free in all others.
For example, eBay doesn’t “control” much of what happens on its vast global network. It allows buyers and sellers to interact as they will. What makes the network so successful is the clear framework of rules (the exclusion of certain product categories and bidding processes, for example) that are just firm enough to protect the interests of the greater good and no more restrictive. Certainly no one would accuse eBay of stifling creativity that inhibits growth.
Marketers have long understood this paradox in key efforts like ad copy briefs. Decades of experience have shown that the best creative briefs focus succinctly on a distinct business objective and impose as few firm parameters as possible, but do include some. The creatives must work within the parameters to find new dimensions of communications effectiveness that achieve the business goal. Apply too many parameters, and you’ll get boring, uninspired copy unlikely to accomplish its mission of persuasion. Define too few, and the ads diverge from the strategy, unlikely to create the desired attitudinal or behavioral shifts.
This is how Malone’s “paradox” works. The better defined the playing field is, the more likely the result will be a win. Finding the right balance between objective definition and subjective interpretation is the difference between winning and losing.
But achieving this balance is certainly not easy in the explosive complexity of today’s marketing organization. Several companies who have made good progress report that their success came from evolving from a command-and-control structure to one focused on defining the right set of controls and then applying all energies to drawing the best out of more autonomous, decentralized operating groups.
McDonald’s, for example, has employed a “flexible framework” to deal with the hundreds of customer segments it serves worldwide, across dozens of cultures. To rebuild its brand relevancy after several years of sales attrition, McDonald’s required that communications be open, honest, and fully transparent while speaking in the consumer’s own voice. Beyond that, McDonald’s sets firm expectations for business outcomes and lets the creative process interpret the brand in each culture in ways most appealing to the local customer.
The learning here seems to be that if you choose the right metrics, your measurement framework might actually enhance creativity and innovation by helping to focus them. But the converse is also likely to be true... if your approach to measurement simply reinforces the parameters that constrain the business today, you might very well be accelerating the cycle of monotony.
It might be worthwhile to think about that when you're considering the hundreds of possible dashboard metrics people might want to stuff on the dashboard.
Thomas W. Malone, professor of management at MIT’s Sloan School of Management, has spent the better part of a long academic career researching organizational effectiveness. In his book, The Future of Work: How the New Order of Business Will Shape Your Organization, Your Management Style, and Your Life, Malone points to a “paradox of standards.” He says clearly and firmly defining a few rules (controls) in the most risky areas of the organization sets creativity free in all others.
For example, eBay doesn’t “control” much of what happens on its vast global network. It allows buyers and sellers to interact as they will. What makes the network so successful is the clear framework of rules (the exclusion of certain product categories and bidding processes, for example) that are just firm enough to protect the interests of the greater good and no more restrictive. Certainly no one would accuse eBay of stifling creativity that inhibits growth.
Marketers have long understood this paradox in key efforts like ad copy briefs. Decades of experience have shown that the best creative briefs focus succinctly on a distinct business objective and impose as few firm parameters as possible, but do include some. The creatives must work within the parameters to find new dimensions of communications effectiveness that achieve the business goal. Apply too many parameters, and you’ll get boring, uninspired copy unlikely to accomplish its mission of persuasion. Define too few, and the ads diverge from the strategy, unlikely to create the desired attitudinal or behavioral shifts.
This is how Malone’s “paradox” works. The better defined the playing field is, the more likely the result will be a win. Finding the right balance between objective definition and subjective interpretation is the difference between winning and losing.
But achieving this balance is certainly not easy in the explosive complexity of today’s marketing organization. Several companies who have made good progress report that their success came from evolving from a command-and-control structure to one focused on defining the right set of controls and then applying all energies to drawing the best out of more autonomous, decentralized operating groups.
McDonald’s, for example, has employed a “flexible framework” to deal with the hundreds of customer segments it serves worldwide, across dozens of cultures. To rebuild its brand relevancy after several years of sales attrition, McDonald’s required that communications be open, honest, and fully transparent while speaking in the consumer’s own voice. Beyond that, McDonald’s sets firm expectations for business outcomes and lets the creative process interpret the brand in each culture in ways most appealing to the local customer.
The learning here seems to be that if you choose the right metrics, your measurement framework might actually enhance creativity and innovation by helping to focus them. But the converse is also likely to be true... if your approach to measurement simply reinforces the parameters that constrain the business today, you might very well be accelerating the cycle of monotony.
It might be worthwhile to think about that when you're considering the hundreds of possible dashboard metrics people might want to stuff on the dashboard.
Monday, January 02, 2006
Winning the Guessing Game
Despite all the hand-wringing over marketing getting "a seat at the boardroom table," the irreversible trend we’re seeing in measurement of marketing effectiveness has improved both the return on marketing expenditures and the credibility of the marketing function within the corporation. Database technology, analytics, and Web presentation tools have all contributed to an unstoppable wave of desire to understand and quantify the impact of marketing expenditures on the company’s bottom line. All this is unquestionably for the better.
But there's a much bigger game being played out in corporate boardrooms, one in which dashboards are performing a critically important function. And sometimes marketers get so wrapped up in the financial and statistical orgy of metrics they lose sight of the true competitive advantage afforded by an effective marketing dashboard.
You see, the things that are countable can be counted by anyone. Given similar resources, competitors will always achieve parity with respect to the foundational elements of statistical analysis and optimization. Everyone will soon have their own media-mix model, and portfolio management of ROI will become the de facto standard for how marketing resources are allocated.
But what can truly separate us from our competitors and deliver exploitable marketplace advantage is not being better counters, but becoming better guessers.
Guessing is what we do when we don’t have enough information to be certain about the likely outcome of a decision — which is most of the time.
There’s a strange correlation between the potential magnitude of the risk of a given decision and the propensity to have to guess. The two are directly proportional. That’s why people still manage companies and computers just provide “decision support.”
I've seen effective marketing dashboards facilitate a better guessing organization in two ways:
But there's a much bigger game being played out in corporate boardrooms, one in which dashboards are performing a critically important function. And sometimes marketers get so wrapped up in the financial and statistical orgy of metrics they lose sight of the true competitive advantage afforded by an effective marketing dashboard.
You see, the things that are countable can be counted by anyone. Given similar resources, competitors will always achieve parity with respect to the foundational elements of statistical analysis and optimization. Everyone will soon have their own media-mix model, and portfolio management of ROI will become the de facto standard for how marketing resources are allocated.
But what can truly separate us from our competitors and deliver exploitable marketplace advantage is not being better counters, but becoming better guessers.
Guessing is what we do when we don’t have enough information to be certain about the likely outcome of a decision — which is most of the time.
There’s a strange correlation between the potential magnitude of the risk of a given decision and the propensity to have to guess. The two are directly proportional. That’s why people still manage companies and computers just provide “decision support.”
I've seen effective marketing dashboards facilitate a better guessing organization in two ways:
- By assembling the relevant information in a form and manner that improves the ability of the human mind to find the synaptic links between previously unrelated elements and see patterns where no numerical analysis has.
- By providing a “learning loop” to rapidly test assumptions (a.k.a. “guesses”) against observable facts to enhance the quality of the decisions in the face of uncertainty.
In a world of rapid assimilation of information, it’s the development of proprietary insights that will distinguish one company from another. Insights can start out as just “guesses” but, through tools like the marketing dashboard, rapidly evolve to become known facts long before the competitors ever figure it out.
Wednesday, December 21, 2005
Can You Link Brand Ads to Profits?
How do you know if your "brand advertising" is creating real financial value?
Let’s say you have a tracking study out in the market in which you’ve identified 15 key brand attributes and have a sampling of customers and prospects rating your brand vs. competitors on each attribute. You also ask about self-reported purchase activity in your category. You survey 200 people each month and read the results on a rolling three-month basis.
Now, using statistical regression techniques, you can correlate brand attribute ratings to purchase activity or purchase intentions to identify the attributes that are most strongly associated with increased category or brand purchase behavior.
Simple, right? Hardly.
There are a great many places where this approach can get derailed or become seriously misleading.
First off, self-reported purchase behavior can be significantly different from actual purchase behavior. Sometimes, people forget how much they bought and which brands. Other times they tell little white lies to protect themselves from the judgment of others (even the interviewer). If you can connect a specific individual’s survey responses back to that person’s actual purchase behavior as reflected in your transactional files, you can close the gap somewhat. If not, you might check to see if there's a syndicated "panel" study done in your category where consumers respond to survey questions and share their actual receipts or credit card statements. Failing that, you can conduct a separate study specifically among a group of category consumers and check to see how self-reported behavior varies from actual purchases, then use that as an error factor to adjust what you get from your tracking studies.
Second, attributes are commonly “lumped” together by consumers into positive and negative buckets, making it difficult to see any one attribute as a real driver to a greater degree than others. This is the covariance effect — a statistical term indicating the extent to which two or more elements move in the same direction. Sometimes it’s helpful to group attributes with high covariance into “factors,” or higher-level descriptions. For example, the attributes “offers good value for the money” and “is priced competitively” might be grouped into a factor called “price appeal.” As long as you aren’t grouping so many attributes together into a few still undistinguishable factors, you can still get a strong feeling for which elements of the brand scorecard might be most important.
There are many more ways that this process can become subtly misleading. If you’re not a research professional or statistician, you might consider consulting one of each in your methodology design. But, time and again, interviews with researchers suggest that the best approaches start with sound qualitative research among customers and prospects to identify the possible list of driver attributes and articulate them in ways that are clear and distinct to survey respondents.
Done correctly, this effort can help directly link changes in attitudes or perceptions caused by brand advertising back to incremental economic value creation. But obviously it takes time and money to lay this foundation. If you're spending a few million (or more) annually on brand advertising though, it might just be worth it.
Have you been able to identify specific aspects of your brand that drive customer relationships? We'd like to hear your story.
Let’s say you have a tracking study out in the market in which you’ve identified 15 key brand attributes and have a sampling of customers and prospects rating your brand vs. competitors on each attribute. You also ask about self-reported purchase activity in your category. You survey 200 people each month and read the results on a rolling three-month basis.
Now, using statistical regression techniques, you can correlate brand attribute ratings to purchase activity or purchase intentions to identify the attributes that are most strongly associated with increased category or brand purchase behavior.
Simple, right? Hardly.
There are a great many places where this approach can get derailed or become seriously misleading.
First off, self-reported purchase behavior can be significantly different from actual purchase behavior. Sometimes, people forget how much they bought and which brands. Other times they tell little white lies to protect themselves from the judgment of others (even the interviewer). If you can connect a specific individual’s survey responses back to that person’s actual purchase behavior as reflected in your transactional files, you can close the gap somewhat. If not, you might check to see if there's a syndicated "panel" study done in your category where consumers respond to survey questions and share their actual receipts or credit card statements. Failing that, you can conduct a separate study specifically among a group of category consumers and check to see how self-reported behavior varies from actual purchases, then use that as an error factor to adjust what you get from your tracking studies.
Second, attributes are commonly “lumped” together by consumers into positive and negative buckets, making it difficult to see any one attribute as a real driver to a greater degree than others. This is the covariance effect — a statistical term indicating the extent to which two or more elements move in the same direction. Sometimes it’s helpful to group attributes with high covariance into “factors,” or higher-level descriptions. For example, the attributes “offers good value for the money” and “is priced competitively” might be grouped into a factor called “price appeal.” As long as you aren’t grouping so many attributes together into a few still undistinguishable factors, you can still get a strong feeling for which elements of the brand scorecard might be most important.
There are many more ways that this process can become subtly misleading. If you’re not a research professional or statistician, you might consider consulting one of each in your methodology design. But, time and again, interviews with researchers suggest that the best approaches start with sound qualitative research among customers and prospects to identify the possible list of driver attributes and articulate them in ways that are clear and distinct to survey respondents.
Done correctly, this effort can help directly link changes in attitudes or perceptions caused by brand advertising back to incremental economic value creation. But obviously it takes time and money to lay this foundation. If you're spending a few million (or more) annually on brand advertising though, it might just be worth it.
Have you been able to identify specific aspects of your brand that drive customer relationships? We'd like to hear your story.
Sunday, December 11, 2005
Forward-Leaning Metrics
Most of us have a pretty keen ability to look backward and know where we’ve been. Many of us have even advanced that skill to be able to look around and know where we are at the moment. But knowing whether you’re on track for where you expect to be six, 12, 18 months from now … that’s something only a very few managers have mastered.
Today, marketing reporting, and to some degree financial reporting, is primarily a function of gathering sales data at the end of a reporting period, massaging it into charts and graphs, and then circulating it for discussion or comment. And for most, even this is no small accomplishment.
This diagnostic approach is rooted in the instinctive human learning method of interpreting past experiences to frame future expectations. At best, that process is effective at helping the organization see where it’s recently been. Only through very intuitive methods do companies attempt to project the trajectory of performance into the future so they can manage to the desired outcome. And only a very few possess the innate (or artistic) ability to properly view diagnostic information and project it with reasonable accuracy, overcoming their own perceptual biases and assimilating the collective wisdom of their entire team. This is the fundamental human frailty marketing dashboards can help overcome.
Without a doubt, there is benefit to having diagnostic measurements on your dashboard. But without components that help you predict the future, the dashboard is only expanding the limitations of memory, not improving decision making. Think again about the dashboard on your car and how it works with your vision and stored experiences. You keep your eyes fixed on the road ahead with only quick glances at the dashboard to see how speed, fuel level, and engine stress will affect the desired outcome of arriving at your destination. Your brain makes millions of calculations per second to adjust the turn of the wheel, the pressure on the gas pedal, and the search for rest areas along the way. You might even have reviewed a map before starting out to form a mental picture in your mind of where you were going.
Today’s vehicles are increasingly equipped with some “forward-looking” dashboard capabilities. Compasses are being replaced by GPS systems that provide real-time mapping to guide you to your destination, alerting you in advance to upcoming turns. Fuel gauges are evolving to become distance-to-empty meters that display not just the current level of the tank, but how far you can go before stopping based on constantly updated fuel economy readings. By focusing your thinking on the journey ahead, these advances make driving easier and more efficient.
However, most marketing dashboard metrics are still being presented in the form of current vs. prior period. That’s helpful in terms of seeing the trend to the current point in time. But, to use the vehicular metaphor, it would be like driving forward while looking in the rear-view mirror — more than a little dangerous.
The metrics on a marketing dashboard highlighting current performance should be compared to a forecast for where they’re supposed to be at that point in time relative to the longer-term goals. That way, the dashboard answers the question, “Where is my projected outcome vs. my target outcome?” Proper marketing dashboard readings give you an indication of whether you’re on the right course, at the right speed, and have enough gas in your tank to get to your desired destination, not just any destination. If the dashboard says you’re off course, you can look at past-performance data for diagnostic insights and ideas on how to course-correct, but no longer will looking back be your central focus (or the focus of countless hours of discussions and justification exercises).
Today, marketing reporting, and to some degree financial reporting, is primarily a function of gathering sales data at the end of a reporting period, massaging it into charts and graphs, and then circulating it for discussion or comment. And for most, even this is no small accomplishment.
This diagnostic approach is rooted in the instinctive human learning method of interpreting past experiences to frame future expectations. At best, that process is effective at helping the organization see where it’s recently been. Only through very intuitive methods do companies attempt to project the trajectory of performance into the future so they can manage to the desired outcome. And only a very few possess the innate (or artistic) ability to properly view diagnostic information and project it with reasonable accuracy, overcoming their own perceptual biases and assimilating the collective wisdom of their entire team. This is the fundamental human frailty marketing dashboards can help overcome.
Without a doubt, there is benefit to having diagnostic measurements on your dashboard. But without components that help you predict the future, the dashboard is only expanding the limitations of memory, not improving decision making. Think again about the dashboard on your car and how it works with your vision and stored experiences. You keep your eyes fixed on the road ahead with only quick glances at the dashboard to see how speed, fuel level, and engine stress will affect the desired outcome of arriving at your destination. Your brain makes millions of calculations per second to adjust the turn of the wheel, the pressure on the gas pedal, and the search for rest areas along the way. You might even have reviewed a map before starting out to form a mental picture in your mind of where you were going.
Today’s vehicles are increasingly equipped with some “forward-looking” dashboard capabilities. Compasses are being replaced by GPS systems that provide real-time mapping to guide you to your destination, alerting you in advance to upcoming turns. Fuel gauges are evolving to become distance-to-empty meters that display not just the current level of the tank, but how far you can go before stopping based on constantly updated fuel economy readings. By focusing your thinking on the journey ahead, these advances make driving easier and more efficient.
However, most marketing dashboard metrics are still being presented in the form of current vs. prior period. That’s helpful in terms of seeing the trend to the current point in time. But, to use the vehicular metaphor, it would be like driving forward while looking in the rear-view mirror — more than a little dangerous.
The metrics on a marketing dashboard highlighting current performance should be compared to a forecast for where they’re supposed to be at that point in time relative to the longer-term goals. That way, the dashboard answers the question, “Where is my projected outcome vs. my target outcome?” Proper marketing dashboard readings give you an indication of whether you’re on the right course, at the right speed, and have enough gas in your tank to get to your desired destination, not just any destination. If the dashboard says you’re off course, you can look at past-performance data for diagnostic insights and ideas on how to course-correct, but no longer will looking back be your central focus (or the focus of countless hours of discussions and justification exercises).
Thursday, December 08, 2005
Revenue Metrics - Bad for Credibility
Marketers show a tendency to use dashboard metrics that relate to revenue (topline sales) as opposed to profits (bottom line). This is a critical error that not only risks misleading decision makers about the effectiveness of marketing investments, but also perpetuates the cynicism with which other departments view marketing.
The potential to be misleading is relevant in that marketing costs must be allocated to the sales they generate before we determine the net incremental profits derived from the marketing investment. If we spend $5 million in marketing to generate $10 million in sales, fine. If the cost of goods sold (COGS, fully loaded with fixed cost allocations) is less than $4 million, we probably made money. But if the COGS is more than $4 million, we’ve delivered slightly better than breakeven on the investment and more likely lost money when taking into account the real or opportunity cost of capital.
Presenting marketing effectiveness metrics in revenue terms is seen as naive by the CFO and other members of the executive committee for very much the same reason as outlined above. Continuing to do so undermines the credibility of the marketing department, particularly when profits, contribution margins, or even gross margins can be approximated.
In my experience, there are several common rationalizations for using revenue metrics, including:
The potential to be misleading is relevant in that marketing costs must be allocated to the sales they generate before we determine the net incremental profits derived from the marketing investment. If we spend $5 million in marketing to generate $10 million in sales, fine. If the cost of goods sold (COGS, fully loaded with fixed cost allocations) is less than $4 million, we probably made money. But if the COGS is more than $4 million, we’ve delivered slightly better than breakeven on the investment and more likely lost money when taking into account the real or opportunity cost of capital.
Presenting marketing effectiveness metrics in revenue terms is seen as naive by the CFO and other members of the executive committee for very much the same reason as outlined above. Continuing to do so undermines the credibility of the marketing department, particularly when profits, contribution margins, or even gross margins can be approximated.
In my experience, there are several common rationalizations for using revenue metrics, including:
- limited data availability;
- an inability to accurately allocate costs to get from revenue to profit; and/or
- a belief that since others in the organization ultimately determine pricing and fixed and variable costs, marketing is primarily a topline-driving function that does not influence the bottom line.
To the first of these, I empathize. Many companies suffer from legacy sales reporting infrastructures where only the topline numbers are available or updated with a minimum of monthly frequency. If you’re in one of those, we encourage you to use either the last month’s or a 12-month rolling average net or gross margin percentage to apply to revenue. Finance can help you develop reasonable approximations to translate revenues to profits in your predictive metrics. You can always calibrate your approximations later when the actual numbers become available.
If you suffer from the second of these, an inability to allocate costs precisely, consider using “gross margins after marketing” (revenue less COGS less marketing expenses). Most companies know what their gross margins are by product line, and most CFOs are willing to acknowledge that incremental gross margins after marketing that exceed the overhead cost rate of the company are likely generating incremental profits. This is particularly true in companies in which the incremental sales derived from marketing activities are not necessitating capital investments in expanding production or distribution capacity. In short, engage finance in the conversation and collectively work to arrive at a best guess.
If you find yourself in the third group, you need to get your head out of the sand. The reality is that the mission of marketing is to generate incremental profits, not just revenue. If that means working with sales to find out how you need to change customer attitudes, needs, or perceptions to reduce the price elasticity for your products and services, do it. Without effective marketing to create value-added propositions for customers, sales may feel forced to continue to discount to make their goals, leading the entire organization into a slow death spiral — which, ironically, will start with cuts in the marketing budget.
If you identified with this third group, this should be a wake-up call that your real intentions for considering a dashboard are to justify your marketing expenditures, not really measure them for the purpose of improving. If that’s the case, you’re wasting your time. Your CEO and CFO will soon see your true motivation and won’t buy into your thinking anyway.
Having said all that, there are some times when using revenue metrics is highly appropriate. Usually those relate to measurements of share-of-customer spending or share-of-market metrics that relate to the total pie being pursued, not those attempting to measure the financial efficiency or effectiveness of the marketing investment.
In addition, be especially careful with metrics featuring ROI. If ROI is a function of the net change in profit divided by the investment required to achieve it, it can be manipulated by either reducing the investment or overstating the net profit change beyond that directly attributable to the marketing stimulus. Remember that the goal is to increase the net profit by as much as we can, as fast as we can, not just to improve the ROI. That’s just a relative measure of efficiency in our approach, not overall effectiveness.
Wednesday, December 07, 2005
How Much Risk Is in Your Marketing Plan?
Globalization, multichannel marketing, supply-chain management, strategic alliances, regulations, corporate governance — marketing is riskier today than ever. To put their companies at competitive advantage, marketers need to take more calculated risks. Yet to most marketing departments, "risk management" is limited to customer credit and vetting vendors — functions usually handled by finance or purchasing.
For marketing executives, risk management is a trial-and-error evolution. Has this agency produced good work previously? Will this vendor deliver on time? Experience has fine-tuned our instincts to a point where we intuitively assess risks based upon a combination of hundreds of deliberately and subconsciously collected data points.
Many executive committee members still view marketing as the last bastion of significant risk exposure. Everyone else from finance to operations, HR to IT employs robust risk-assessment tools and processes and highly effective ways to demonstrate the risk-adjusted outcomes of their key projects. They talk in terms of "net present value" of "future returns" associated with an investment made today. They link their recommendations to the bottom line and present their cases in such a way as to reassure not just the CEO, but also their peers, that they have carefully analyzed the financial, operational, organizational, and environmental risks and are proposing the optimal solution with the best likely outcome.
This process needs to be carried into the marketing measurement platform. Each proposed initiative or program should be evaluated not just on its total potential return, but on its risk-adjusted potential.
Here’s an example: Let’s say we’re a retailer planning a holiday sale. We plan to run $1 million of TV advertising to drive traffic into stores during this one-day extravaganza. Using the reach and frequency data we get from our media department, combined with our assessment of the likely impact of the advertising copy, we estimate that about one million incremental customers will visit our stores on that day. If only 5% of them purchase at our average gross-margin per transaction of $20, we break even, right?
Unless, of course, it rains. In that case, our media will reach far more people watching TV inside, but far fewer will venture out to shop. Or maybe the weather will be fine, but one of our competitors will simultaneously announce a major sale event of their own featuring some attractive loss-leaders to entice traffic into their stores. Or maybe there will be some geopolitical news event that disturbs the normal economic optimism of our customers, causing them to cancel or postpone buying plans for a while.
Any or all of these things could happen. It only takes one to completely mess up the projected return on the $1 million investment in sale advertising.
This structured risk-assessment approach will highlight investments that are more prone to external risk factors and modify their rosy expectations accordingly. In the end, high-risk, high-reward initiatives may be just what’s required to achieve business goals, but wouldn’t you rather know that’s what you are approving, instead of finding it out later when high hopes are dashed?
For marketing executives, risk management is a trial-and-error evolution. Has this agency produced good work previously? Will this vendor deliver on time? Experience has fine-tuned our instincts to a point where we intuitively assess risks based upon a combination of hundreds of deliberately and subconsciously collected data points.
Many executive committee members still view marketing as the last bastion of significant risk exposure. Everyone else from finance to operations, HR to IT employs robust risk-assessment tools and processes and highly effective ways to demonstrate the risk-adjusted outcomes of their key projects. They talk in terms of "net present value" of "future returns" associated with an investment made today. They link their recommendations to the bottom line and present their cases in such a way as to reassure not just the CEO, but also their peers, that they have carefully analyzed the financial, operational, organizational, and environmental risks and are proposing the optimal solution with the best likely outcome.
This process needs to be carried into the marketing measurement platform. Each proposed initiative or program should be evaluated not just on its total potential return, but on its risk-adjusted potential.
Here’s an example: Let’s say we’re a retailer planning a holiday sale. We plan to run $1 million of TV advertising to drive traffic into stores during this one-day extravaganza. Using the reach and frequency data we get from our media department, combined with our assessment of the likely impact of the advertising copy, we estimate that about one million incremental customers will visit our stores on that day. If only 5% of them purchase at our average gross-margin per transaction of $20, we break even, right?
Unless, of course, it rains. In that case, our media will reach far more people watching TV inside, but far fewer will venture out to shop. Or maybe the weather will be fine, but one of our competitors will simultaneously announce a major sale event of their own featuring some attractive loss-leaders to entice traffic into their stores. Or maybe there will be some geopolitical news event that disturbs the normal economic optimism of our customers, causing them to cancel or postpone buying plans for a while.
Any or all of these things could happen. It only takes one to completely mess up the projected return on the $1 million investment in sale advertising.
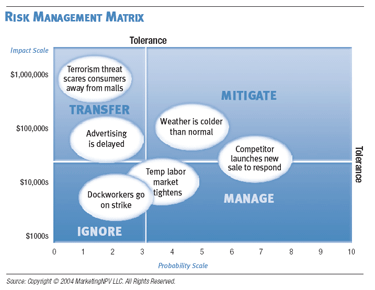
This structured risk-assessment approach will highlight investments that are more prone to external risk factors and modify their rosy expectations accordingly. In the end, high-risk, high-reward initiatives may be just what’s required to achieve business goals, but wouldn’t you rather know that’s what you are approving, instead of finding it out later when high hopes are dashed?
Friday, December 02, 2005
The Dangers of Premature Delegation
When responsibility for selecting critical marketing metrics gets delegated by the CMO to one of his or her direct reports (or even an indirect report once- or twice-removed), it sets off a series of unfortunate events reminiscent of Lemony Snicket in the boardroom.
First of all, the fundamental orientation for the process starts off on an "inside/out" track. Middle managers tend (emphasize tend) to have a propensity to view the role of marketing with a bias favoring their personal domain of expertise or responsibility. It's just natural. Sure you can counterbalance by naming a team of managers who will supposedly neutralize each others' biases, but the result is often a recommendation derived primarily through compromise amongst peers whose first consideration is often a need to maintain good working relationships. Worse yet, it may exacerbate the extent to which the measurement challenge is viewed as an internal marketing project, and not a cross-organizational one. Measurement of marketing needs to begin with an understanding of the specific role of marketing within the organization. That's a big task for most CMOs to clarify, never mind hard-working folks who might not have the benefit of the broader perspective.
Second, delegating elevates the chances that the proposed metrics will be heavily weighted towards things that can more likely be accomplished (and measured) within the autonomy scope of the marketing department. Intermediary metrics like awareness or leads generated are accorded greater weight because of the degree of control the recommender perceives they (or the marketing department) have over the outcome. The danger here is of course that these may be the very same "marketing-babble" concepts that frustrate the other members of the executive committee today and undermine the perception that marketing really is adding value.
Third, when measurement is delegated, reality is often a casualty. The more people who review the metrics before they are presented to the CMO, the greater the likelihood they will arrive "polished" in some more-or-less altruistic manner to slightly favor all of the good things that are going on, even if the underlying message is a disturbing one. Again, human nature.
The right role for the CMO in the process is to champion the need for an insightful, objective measurement framework, and then to engage their executive committee peers in framing and reviewing the evolution of it. Further, the CMO needs to ruthlessly screen the proposed metrics to ensure they are focused on the key questions facing the business and not just reflecting the present perspectives or operating capabilities. Finally, the CMO needs to be the lead agent of change, visibly and consistently reinforcing the need for rapid iteration towards the most insightful measures of effectiveness and efficiency, and promoting continuous improvement. In other words, they need to take a personal stake in the measurement framework and tie themselves visibly to it so others will more willingly accept the challenge. There are some very competent, productive people working for the CMO who would love to take this kind of a project on and uncover all the areas for improvement. People who can do a terrific job of building insightful, objective measurement capabilities. But the CMO who delegates too much responsibility for directing the early stages risks undermining both their abilities and their enthusiasm -- not to mention the ultimate credibility of the solution both within and beyond the marketing department.
First of all, the fundamental orientation for the process starts off on an "inside/out" track. Middle managers tend (emphasize tend) to have a propensity to view the role of marketing with a bias favoring their personal domain of expertise or responsibility. It's just natural. Sure you can counterbalance by naming a team of managers who will supposedly neutralize each others' biases, but the result is often a recommendation derived primarily through compromise amongst peers whose first consideration is often a need to maintain good working relationships. Worse yet, it may exacerbate the extent to which the measurement challenge is viewed as an internal marketing project, and not a cross-organizational one. Measurement of marketing needs to begin with an understanding of the specific role of marketing within the organization. That's a big task for most CMOs to clarify, never mind hard-working folks who might not have the benefit of the broader perspective.
Second, delegating elevates the chances that the proposed metrics will be heavily weighted towards things that can more likely be accomplished (and measured) within the autonomy scope of the marketing department. Intermediary metrics like awareness or leads generated are accorded greater weight because of the degree of control the recommender perceives they (or the marketing department) have over the outcome. The danger here is of course that these may be the very same "marketing-babble" concepts that frustrate the other members of the executive committee today and undermine the perception that marketing really is adding value.
Third, when measurement is delegated, reality is often a casualty. The more people who review the metrics before they are presented to the CMO, the greater the likelihood they will arrive "polished" in some more-or-less altruistic manner to slightly favor all of the good things that are going on, even if the underlying message is a disturbing one. Again, human nature.
The right role for the CMO in the process is to champion the need for an insightful, objective measurement framework, and then to engage their executive committee peers in framing and reviewing the evolution of it. Further, the CMO needs to ruthlessly screen the proposed metrics to ensure they are focused on the key questions facing the business and not just reflecting the present perspectives or operating capabilities. Finally, the CMO needs to be the lead agent of change, visibly and consistently reinforcing the need for rapid iteration towards the most insightful measures of effectiveness and efficiency, and promoting continuous improvement. In other words, they need to take a personal stake in the measurement framework and tie themselves visibly to it so others will more willingly accept the challenge. There are some very competent, productive people working for the CMO who would love to take this kind of a project on and uncover all the areas for improvement. People who can do a terrific job of building insightful, objective measurement capabilities. But the CMO who delegates too much responsibility for directing the early stages risks undermining both their abilities and their enthusiasm -- not to mention the ultimate credibility of the solution both within and beyond the marketing department.
Tuesday, November 29, 2005
The Value of Knowing
One of the most common questions we get on marketing measurement begins with "How would you measure ...?"
When I hear those trigger words, my mind immediately goes to the response question: "What would you do with the information if you had it?"
There are two reasons the response question is so important prior to answering the original question.
First, the answer to the response question will help me understand the extent to which your organization has developed a thoughtful (if executionally challenged) perspective on critical metrics, or if you're still in the mode of identifying the superset of all possible things that might be measured.
Second, the answer will tell me the relative importance of the particular piece of information you're looking for and give me some sense of the economic value of having better certainty of knowledge. If having the knowledge will improve your business outcomes just marginally or not at all, we can pretty quickly agree that it doesn't really matter how we'd measure it. Conversely, if the expected economic value of knowing is significant, many possible doors open in terms of collection avenues, since we can presumably allocate a fair amount of resources to acquiring the knowledge and still show a very positive return on that investment.
Third (yes, I know I said there were only two, but it's a blog so cut me some slack), if your answer to the response question doesn't properly anticipate how having the knowledge would impact current decision processes, it's a sign that we need to lay some organizational groundwork before we even ask for the resources to go get the knowledge.
As you might imagine, most people are initially stumped by the response question. But if you think about your hairiest, most formidable measurement challenges in the context of the economic value of knowing, you really begin to define your priorities for knowledge aggregation.
Everything can be reliably measured -- somehow. The critical parameters (as in most business pursuits) are how much time, money, and political capital you're prepared to spend to acquire the knowledge. You can't possibly know what your tolerances are until you have some clarity on the value of knowing.
When I hear those trigger words, my mind immediately goes to the response question: "What would you do with the information if you had it?"
There are two reasons the response question is so important prior to answering the original question.
First, the answer to the response question will help me understand the extent to which your organization has developed a thoughtful (if executionally challenged) perspective on critical metrics, or if you're still in the mode of identifying the superset of all possible things that might be measured.
Second, the answer will tell me the relative importance of the particular piece of information you're looking for and give me some sense of the economic value of having better certainty of knowledge. If having the knowledge will improve your business outcomes just marginally or not at all, we can pretty quickly agree that it doesn't really matter how we'd measure it. Conversely, if the expected economic value of knowing is significant, many possible doors open in terms of collection avenues, since we can presumably allocate a fair amount of resources to acquiring the knowledge and still show a very positive return on that investment.
Third (yes, I know I said there were only two, but it's a blog so cut me some slack), if your answer to the response question doesn't properly anticipate how having the knowledge would impact current decision processes, it's a sign that we need to lay some organizational groundwork before we even ask for the resources to go get the knowledge.
As you might imagine, most people are initially stumped by the response question. But if you think about your hairiest, most formidable measurement challenges in the context of the economic value of knowing, you really begin to define your priorities for knowledge aggregation.
Everything can be reliably measured -- somehow. The critical parameters (as in most business pursuits) are how much time, money, and political capital you're prepared to spend to acquire the knowledge. You can't possibly know what your tolerances are until you have some clarity on the value of knowing.
Friday, November 25, 2005
Measure What You SHOULD, Not Just What You CAN
In the midst of a dashboard planning session last week, the VP Marketing Intelligence brought the meeting to an abrupt halt by saying, "This is all nice in theory, but we don't have the data to measure half of these things."
Hmmm. Good point. Very pragmatic. Or at least that was the initial reaction of most of his teammates in the room.
But let's think for a minute about the implication of only measuring what we have data for.
Hmmm. Good point. Very pragmatic. Or at least that was the initial reaction of most of his teammates in the room.
But let's think for a minute about the implication of only measuring what we have data for.
- In all likelihood, we don't have much insight into the data streams we have today, or we wouldn't be talking about assembling a dashboard in the first place.
- The "spotty" data we have today leaves significant gaps between what we know, what we don't know, and most importantly, what we don't know we don't know.
- Keeping our dashboard framed within the parameters of what we already have data for is a sure fire way to reinforce every preconceived notion we have about the business.
I'm all for pragmatism. Nobody is helped by a theoretical marketing dashboard. But the very process of planning a dashboard is intended to draw out all of our structured knowledge, scientific hypotheses, and experiential best-guesses about what happens to sales or profits when we add/change/delete marketing investments. Only by looking at the business from the perspective of "what should we be measuring" and setting the framework for a truly comprehensive view of effectiveness and efficiency can we really assess what we know and where we should prioritize our search for more knowledge.
Fact: Most marketing organizations spend far too much time and precious resources answering questions that don't generate any significant insights into the business. Laying out the complete picture of what you think you need to know first is the best way to keep your marketing measurement efforts from returning the same old knowledge with the same critical insight gaps.
It makes better sense to start with what you want to know, prioritize the pursuit of the unknowns on the basis of expected insight value, and fill in the gaps in your dashboard over time. But let everyone see the gaps as a reminder of how little we actually do know and a reassurance that we, the marketers, are diligently working to try to close those gaps. It will make them feel better about our search for objective insight.
Tuesday, November 22, 2005
Peter Drucker – Our Thanks
Peter Drucker, perhaps the greatest business academic ever, died on November 11 at age 95 in Claremont, California. Many know him for developing concepts like knowledge workers and decentralized management. We at MarketingNPV thank him for two insights that have an impact on every minute of our working days.
The first is management by objectives. The concept of setting objectives and allowing teams to work toward them is now commonplace, but before Drucker, command and control reigned. We at MarketingNPV cannot imagine doing our jobs without the discipline of MBO already in place. In fact, measurement of progress towards marketing objectives is much of what we do.
The second great insight we use every day to help clarify marketing’s role within a company. Drucker wrote, "Business, because its function is to create and sustain a customer, has only two purposes: Marketing and Innovation. Everything else is an expense." Many well-established companies undervalue both elements because they are living of the franchises created by earlier marketing and innovation. Success often boils down to how well the company tends its brands and customer franchise. And without measurement, marketers are hobbled in their ability to make the most of the assets under their care.
Pete Drucker may no longer be with us, but his work lives on in almost every business person every day.
The first is management by objectives. The concept of setting objectives and allowing teams to work toward them is now commonplace, but before Drucker, command and control reigned. We at MarketingNPV cannot imagine doing our jobs without the discipline of MBO already in place. In fact, measurement of progress towards marketing objectives is much of what we do.
The second great insight we use every day to help clarify marketing’s role within a company. Drucker wrote, "Business, because its function is to create and sustain a customer, has only two purposes: Marketing and Innovation. Everything else is an expense." Many well-established companies undervalue both elements because they are living of the franchises created by earlier marketing and innovation. Success often boils down to how well the company tends its brands and customer franchise. And without measurement, marketers are hobbled in their ability to make the most of the assets under their care.
Pete Drucker may no longer be with us, but his work lives on in almost every business person every day.
Thursday, November 17, 2005
5 Magic Metrics
I recently had a conversation with the CMO of a leading global technology company in which they described for me their desire to construct a marketing dashboard focused on the “5 most important metrics” for their business. When I asked her what those might be, she quickly began to list the possibilities – around 10 of them as I recall – before she stopped and admitted that the task might not be so easy.
The more we talked, the more clear it became to her that getting down to the 5 Magic Metrics would take a diligent effort of experimentation and elimination, perhaps starting with 40 or 50. The appropriate metaphor was the old story of “I’m sorry this letter is so long, I didn’t have time to write a shorter one.” The risk of jumping too fast to the logical 5 is that you might select the wrong ones and achieve the wrong goals in a very efficient and effective way.
If you want to get down to the right 5 (or 4 or 6 or however many) metrics that really forecast success, you owe it to yourself (and your CEO) to undertake a thorough exploration of the 30 or 40 hypotheses that would emerge from a cross-functional assessment of “what really drives the business.” You’d probably not be surprised at the lack of consensus within even the best-managed companies on which 30 to even start with.
From there, it takes a bit of effort to acquire the data to test each of them for diagnostic and predictive ability, or to develop a proxy approach for the inevitable majority of metrics where the data doesn’t exist. Not that it can’t be done quickly (read: a few months), but it does require a deliberate effort.
So whenever I get the CMO request for “the 5 magic metrics,” I agree with them that it’s a great idea to strive for simplicity and to align your marketing measurement framework or dashboard to reinforce the company’s specific goals. But I also advise them to be careful about how they issue that direction to their teams, lest they create the impression that they’re only interested in simplicity (which might be interpreted as superficiality), or they send the message that speed is more important than accuracy. They’re both important.
Start with a hypothesis on what the 5 key metrics might be on the highest level on your dashboard, but don’t sacrifice the real insight derived from exploring the broader spectrum of options and validating your hypotheses. The difference will be measured in the credibility and longevity of your measurement plan.
The more we talked, the more clear it became to her that getting down to the 5 Magic Metrics would take a diligent effort of experimentation and elimination, perhaps starting with 40 or 50. The appropriate metaphor was the old story of “I’m sorry this letter is so long, I didn’t have time to write a shorter one.” The risk of jumping too fast to the logical 5 is that you might select the wrong ones and achieve the wrong goals in a very efficient and effective way.
If you want to get down to the right 5 (or 4 or 6 or however many) metrics that really forecast success, you owe it to yourself (and your CEO) to undertake a thorough exploration of the 30 or 40 hypotheses that would emerge from a cross-functional assessment of “what really drives the business.” You’d probably not be surprised at the lack of consensus within even the best-managed companies on which 30 to even start with.
From there, it takes a bit of effort to acquire the data to test each of them for diagnostic and predictive ability, or to develop a proxy approach for the inevitable majority of metrics where the data doesn’t exist. Not that it can’t be done quickly (read: a few months), but it does require a deliberate effort.
So whenever I get the CMO request for “the 5 magic metrics,” I agree with them that it’s a great idea to strive for simplicity and to align your marketing measurement framework or dashboard to reinforce the company’s specific goals. But I also advise them to be careful about how they issue that direction to their teams, lest they create the impression that they’re only interested in simplicity (which might be interpreted as superficiality), or they send the message that speed is more important than accuracy. They’re both important.
Start with a hypothesis on what the 5 key metrics might be on the highest level on your dashboard, but don’t sacrifice the real insight derived from exploring the broader spectrum of options and validating your hypotheses. The difference will be measured in the credibility and longevity of your measurement plan.
Tuesday, November 15, 2005
Marketers Turning to MOM
There’s a new community emerging within the world of marketing called marketing operations management, “markops” for short, MOM for shorter. Most of the markops people I’ve spoken with so far describe their roles as identifying opportunities for process improvement, and generally getting data and information from point A to point B in a marketing context. There’s great emphasis on improving the customer experience, capitalizing on lead generation, and generally promoting efficiencies.
Importantly, there seems to be a strong understanding amongst markops types that technology is best applied to automate sound business processes and to improve the suboptimal ones constrained by the limits of human processing speed, volume, or accuracy. It’s refreshing to note that this new breed of marketer is pushing automation and technology NOT for the sake of technology or job security (although they do seem to take the measure of one another through subtle clues inherent in the answer to “Which MOM platform are you running?”), but rather in the context of process improvement.
While a few of the markops folks I’ve met have been imported into the marketing department from IT or operations, most seem to share marketing or brand management DNA -- which makes them uniquely capable of envisioning the desirable outcomes of process improvement, not just the process of improvement itself. A high percentage of them are Six-Sigma-trained -- even if their current employer isn’t a Six-Sigma company. Many of the initiatives they’re undertaking are targeted at goals like more efficient e-mail marketing, Web site customization, customer datamart assembly, and integrated campaign optimization. There’s even some discussion of ROI -- albeit mostly still in the context of paying for the investments in the technology.
I think this is a very positive trend for marketing measurement and accountability. Focusing on process and information flows will accelerate the appetite for reliable measurement structures. My hypothesis is that the more tactical focus of the markops function of today will evolve into a more strategic one as the low-hanging fruit of process improvement is picked and the organizational confidence in them grows. In the future, I would expect their unique perspective within the department to translate into leading roles in architecting marketing measurement platforms. Provided, that is, that they can maintain direct access to the CMO, and that they are appropriately skilled in continuously reinventing their job descriptions to consolidate past successes and build bridges across functional groups within the marketing department. But that’s a message that the CMO needs to hear too.
If you’re in marketing operations today, I’d like to hear your perspective on the challenges and opportunities.
Importantly, there seems to be a strong understanding amongst markops types that technology is best applied to automate sound business processes and to improve the suboptimal ones constrained by the limits of human processing speed, volume, or accuracy. It’s refreshing to note that this new breed of marketer is pushing automation and technology NOT for the sake of technology or job security (although they do seem to take the measure of one another through subtle clues inherent in the answer to “Which MOM platform are you running?”), but rather in the context of process improvement.
While a few of the markops folks I’ve met have been imported into the marketing department from IT or operations, most seem to share marketing or brand management DNA -- which makes them uniquely capable of envisioning the desirable outcomes of process improvement, not just the process of improvement itself. A high percentage of them are Six-Sigma-trained -- even if their current employer isn’t a Six-Sigma company. Many of the initiatives they’re undertaking are targeted at goals like more efficient e-mail marketing, Web site customization, customer datamart assembly, and integrated campaign optimization. There’s even some discussion of ROI -- albeit mostly still in the context of paying for the investments in the technology.
I think this is a very positive trend for marketing measurement and accountability. Focusing on process and information flows will accelerate the appetite for reliable measurement structures. My hypothesis is that the more tactical focus of the markops function of today will evolve into a more strategic one as the low-hanging fruit of process improvement is picked and the organizational confidence in them grows. In the future, I would expect their unique perspective within the department to translate into leading roles in architecting marketing measurement platforms. Provided, that is, that they can maintain direct access to the CMO, and that they are appropriately skilled in continuously reinventing their job descriptions to consolidate past successes and build bridges across functional groups within the marketing department. But that’s a message that the CMO needs to hear too.
If you’re in marketing operations today, I’d like to hear your perspective on the challenges and opportunities.
Sunday, November 13, 2005
Brand Measurement Mayhem
Why are there so many ways to measure brand equity? Probably because there is no “right” way to do it.
Many billions of dollars are spent in this country researching and tracking brand equity, most of it through approaches that attempt to carefully dissect the individual image attributes, emotional connections, and perceptions of our companies, brands, or sub-brands. But so little of it is done in a way that inspires confidence amongst CEOs or CFOs that if we increased our ratings on “trustworthy” or “innovative,” we’d see significant improvements in financial results.
Perhaps because there are so many opinions and methodologies about how to correlate changes in key brand equity components to financial outcomes, the lack of consensus, epitomized by multiple vendors extolling their unique, proprietary systems, is possibly ENCOURAGING CFOs to believe that it's all just marketing babble and underscoring the soft, unpredictable nature of it.
Here’s a thought … What if we invited all purveyors of brand equity measurement processes to present their approach and case studies to an independent panel of financial executives, Wall Street analysts, and academics? The panel would then judge the merits of each approach in a fully informed context and propose standards that incorporated best-of-breed methods in a variety of “classes” aligned to the needs of different industry group dynamics — retail, financial services, packaged goods, electronics, automotive, etc.
This approach might actually help close the gap between the marketers and the financial community, moving one or the other towards a better understanding of the inherent challenges of the task and building a better framework for measurement evolution.
I’m not sure the research companies would line up to participate. Ad agencies might hate the idea too.
What do you think?
Many billions of dollars are spent in this country researching and tracking brand equity, most of it through approaches that attempt to carefully dissect the individual image attributes, emotional connections, and perceptions of our companies, brands, or sub-brands. But so little of it is done in a way that inspires confidence amongst CEOs or CFOs that if we increased our ratings on “trustworthy” or “innovative,” we’d see significant improvements in financial results.
Perhaps because there are so many opinions and methodologies about how to correlate changes in key brand equity components to financial outcomes, the lack of consensus, epitomized by multiple vendors extolling their unique, proprietary systems, is possibly ENCOURAGING CFOs to believe that it's all just marketing babble and underscoring the soft, unpredictable nature of it.
Here’s a thought … What if we invited all purveyors of brand equity measurement processes to present their approach and case studies to an independent panel of financial executives, Wall Street analysts, and academics? The panel would then judge the merits of each approach in a fully informed context and propose standards that incorporated best-of-breed methods in a variety of “classes” aligned to the needs of different industry group dynamics — retail, financial services, packaged goods, electronics, automotive, etc.
This approach might actually help close the gap between the marketers and the financial community, moving one or the other towards a better understanding of the inherent challenges of the task and building a better framework for measurement evolution.
I’m not sure the research companies would line up to participate. Ad agencies might hate the idea too.
What do you think?
Wednesday, November 09, 2005
The Mother of All Models
No, we’re not talking about a high-cheekboned, exceptionally fertile female.
What I’m referring to is a tendency I see quite often in corporate America to “crack the code” on marketing measurement by building the world’s biggest regression model.
While admirable in their pursuit, companies that seek to answer the question “What are we getting in return for our marketing investment?” with a number, i.e., “41% ROI,” are headed into a long, dark alley with a penlight. Their chances of getting to a numerical answer with any high degree of confidence is about the same as their chances of finding a specific grain of sand on the ground in that alley.
Along the way, wonderful things are learned about correlations between marketing stimulus programs and business outcomes, most of it negative. In fact, the real value that model-seekers derive is a much higher level of clarity on what doesn’t work. So there is some value to pursuing it. But outside of some packaged goods categories with clearly defined and mature purchase patterns and competitive environments, this approach rarely results in anything close to a perfect prediction of economic outcome in relationship to changes in marketing investments.
The real question is, what is the real question? You see, if you’re trying to ascertain the optimal level of advertising spend to maximize either short-term profitability or ROI, you certainly can build some effective analytical approaches to get to a reasonably small range of uncertainty (a.k.a. high degree of confidence) in an answer. Marketing-mix models can be quite helpful in answering this and similar questions.
But if you’re trying to answer the more common CEO question, “What would happen if I spent twice as much on marketing or half as much?” the answer tends to elude the power of pure analytics absent years of detailed transactional data and previously determined influences of external variables like interest rates, housing starts, demographic mobility, etc.
The bigger the question, the more likely you are to need to a comprehensive combination of marketing metrics to assemble the preponderance of evidence, like a marketing dashboard. Using insights you gain from analytics plus test/control experiments plus research plus some structured forecasting techniques, a marketing dashboard helps focus the company on what it knows and, by definition, what it doesn’t know. Over time, the key questions are identified, researched, and answered.
In short, if your inclination is to try to tackle broad questions of marketing measurement through advanced modeling techniques, you’ve only got part of the solution. Using the full set of tools at your disposal to complement your analytics will enhance your overall ability to answer the really hard measurement questions with greater credibility.
If you’ve had any experience with a modeling-centric approach to marketing measurement, please share it with the rest of us.
What I’m referring to is a tendency I see quite often in corporate America to “crack the code” on marketing measurement by building the world’s biggest regression model.
While admirable in their pursuit, companies that seek to answer the question “What are we getting in return for our marketing investment?” with a number, i.e., “41% ROI,” are headed into a long, dark alley with a penlight. Their chances of getting to a numerical answer with any high degree of confidence is about the same as their chances of finding a specific grain of sand on the ground in that alley.
Along the way, wonderful things are learned about correlations between marketing stimulus programs and business outcomes, most of it negative. In fact, the real value that model-seekers derive is a much higher level of clarity on what doesn’t work. So there is some value to pursuing it. But outside of some packaged goods categories with clearly defined and mature purchase patterns and competitive environments, this approach rarely results in anything close to a perfect prediction of economic outcome in relationship to changes in marketing investments.
The real question is, what is the real question? You see, if you’re trying to ascertain the optimal level of advertising spend to maximize either short-term profitability or ROI, you certainly can build some effective analytical approaches to get to a reasonably small range of uncertainty (a.k.a. high degree of confidence) in an answer. Marketing-mix models can be quite helpful in answering this and similar questions.
But if you’re trying to answer the more common CEO question, “What would happen if I spent twice as much on marketing or half as much?” the answer tends to elude the power of pure analytics absent years of detailed transactional data and previously determined influences of external variables like interest rates, housing starts, demographic mobility, etc.
The bigger the question, the more likely you are to need to a comprehensive combination of marketing metrics to assemble the preponderance of evidence, like a marketing dashboard. Using insights you gain from analytics plus test/control experiments plus research plus some structured forecasting techniques, a marketing dashboard helps focus the company on what it knows and, by definition, what it doesn’t know. Over time, the key questions are identified, researched, and answered.
In short, if your inclination is to try to tackle broad questions of marketing measurement through advanced modeling techniques, you’ve only got part of the solution. Using the full set of tools at your disposal to complement your analytics will enhance your overall ability to answer the really hard measurement questions with greater credibility.
If you’ve had any experience with a modeling-centric approach to marketing measurement, please share it with the rest of us.
Subscribe to:
Posts (Atom)


 Posts
Posts

